What is Elliott Wave Theory?
Elliott Wave Theory, Elliott Wave Principle, or Elliott Waves was discovered by Ralph Nelson Elliott. He developed the analytical tools in the 1930s, and utilized understanding of crowd psychology and social trends to chart.
Elliott developed a rational system of market analysis. He proposed that market prices unfold in specific patterns, and isolated 13 patterns of movements that recur in the market price and are repetitive but not necessarily in time or altitude.
He named, defined and illustrated the patterns and linked them together to form a larger version of those same patterns. These patterns, in turn, link to form identical patterns of the next larger size.
According to Elliott wave theory, after conducting technical and behavioral analysis, several models can be built at extreme points, according to which price movement of the underlying asset shortly is determined.
The theory suggests that any major market move is a cyclical in nature, 5 cycles in the direction of the dominant trend and 3 against the trend.
The 5 waves are called Motive cycles and the other 3 are Corrective. This modeling significantly increase the probability of an accurate forecast with timely entry and exit from the market trend.
That is why the Elliott wave theory is considered as an effective tool for technical analysis of markets.
How Does Ralph Elliott see the market?
The theory is based on the fact that when you get a large group of people together, they act like a herd and less like an individual.
A herd mentally occurs when people are influenced by their peers to adopt certain behavior and follow trends, without centralized direction.
This mentally follows a predictable pattern that can be identified in anything that involves a large group of people such as sporting events, religious gathering, everyday decision-making, judgments and opinions.
Elliott applied this concept to the stock market. So The Elliott wave theory states that the market is fractal in nature, it forms the same patterns that are observed on longer degree charts on smaller timeframe as well.
The theory claims that the market action among participant traders produce wave patterns and trends, defined by Elliott as the physical sign of mass psychology.
How Did The Elliott Wave Theory Developed?
Fear is one the most basic human emotions, and it’s the word we use to describe our emotional reaction when we sense danger or unsafe.
Elliott claimed that social or crowd behavior trends and reverses in a recognizable pattern and his theory is based on reading the patterned human behavior of crowds by its effect on market prices.
Crowds tend to shift from optimism and pessimism naturally. In other words, Elliott proposed that social mood swings are patterned and appear in the price movement of markets, and these movements then tend to follow the Elliott wave model.
Philosophy of Market Movement
Elliott began studying the behavior of the stock market. He went over weekly, daily and self-made hourly charts, and started to notice that market follow patterns and these patterns repeat over and over again.
He relates those patterns to the Nature’s law or the Secret of the Universe. The Elliott Wave theory identifies two types of waves: impulse waves that push the price in the main direction, and corrective waves that are in opposite direction of the main trend.
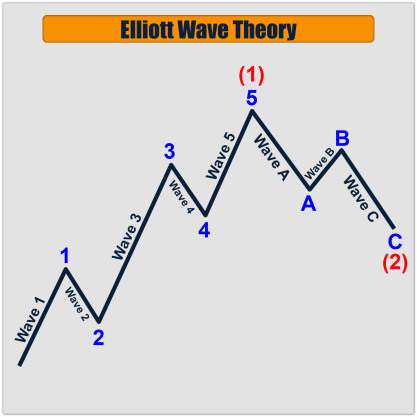
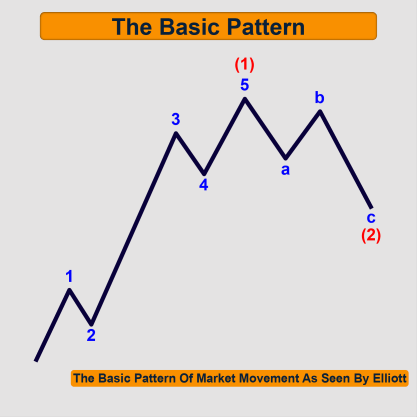
In markets, the Elliott Wave Theory is interpreted as follows: five waves in the direction of the main trend labeled 1,2 ,3 ,4 and 5, followed by three corrective waves labeled A, B and C.
Waves 1, 2,3, 4 and 5 form an impulse wave, alternating between motive and corrective waves.
So waves 1,3 and 5 are impulses while waves 2 and 4 (which are smaller retraces of waves 1 and 3) are correction.
The impulse wave, in turn, forms wave 1 at the next-largest degree, and the corrective wave forms wave 2 at the next-largest degree.
The corrective wave has three distinct price movements. Waves A and C are in the direction of the main trend while wave B is against it.
Elliott Wave Degree
Ralph N. Elliott acknowledged 9 degrees of waves from the Grand Super Cycle degree which is usually found in weekly and monthly time frame to the Sub-minute degree which is found in the hourly time frame. He labelled them as follows:
- Grand Super Cycle
- Super Cycle
- Cycle
- Primary
- Intermediate
- Minor
- Minute
- Minuette
- Sub-Minuette
The waves from the main degree are subdivided into intermediate waves, which are also subdivided into minor waves, and the minor waves, in turn, are also subdivided into minutes waves and then to sub-minutte waves.
These degrees are used when implementing the Elliott Wave analysis or prediction method. They are also used to specify the position of any wave in the overall cycle.
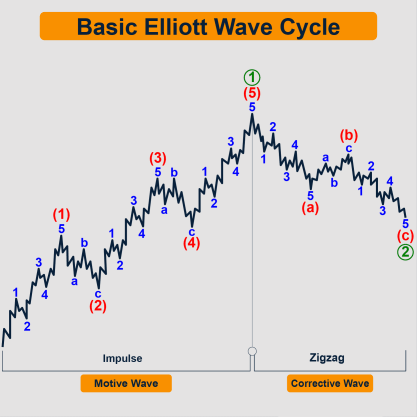
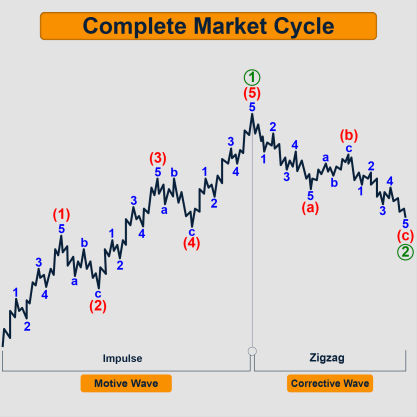
Take a look at the figure above, we see that the wave1 is consisted from 5 waves, and that means wave 1 is just a part of a larger wave.
After the end of the 5 motive waves (complete), we found that these 5 waves form wave 1 of a bigger degree because they are in the direction of the trend of one larger motive wave.
In the corrective waves, we found that the three waves are just a part of a bigger degree and they constitute wave 2.
Wave degrees provide additional information about what waves can appear in the future and what can’t appear.
The highest wave degree is the Grand Supercycle that can cover a period over multiple centuries.
The sub-waves of the Grand Supercycle refer to the next lower degree, the Supercycle which can refers to a period of multi-decades.
Then Supercycle is divided into Cycles or primary degrees, based on the same principle.
The exact identification of the wave degrees is one of the most difficult things in the Elliott wave theory because it’s not based on any exact data.
The outcomes will be obviously vary depending on the degree used.
The missing of historical database is considered the main obstacle in having a more precise wave analysis.
Thus, the more historical data we have, the more credibility we get in analysis using Elliott Wave Theory.
Although we rely heavily on analyzing starting from the main degree to the sub-minutte degree.
The Importance Of Elliott Wave Degree
Suppose that you labeled an upward trend wave as 1 and you waited for correction of 61.8 Fibonacci, which is the standard correction of wave 2.
After that, you found that the price didn’t move as expected and it broke the bottom.
So what was wrong?
The mistake here was in labelling the wave degree, you have to see the waves in the larger degree to label correctly, and that wave that you labeled as 1, it was wave C of flat and that the price was just started a new uptrend movement.
It’s common between analysts and one of the main reasons for having different scenarios.
Basic Cycle Structure In Elliott Wave Theory
The combination of a motive wave and a corrective wave is the general Elliott Wave cycle structure. There is 5 motive waves in the direction of the trend of one larger degree, followed by 3 corrective waves against the higher degree trend.
This cycle is a 5-3 structure, it’s the minimum requirements to achieve both fluctuation and progress in an up or down direction.
Once the cycle ends, it begins again, it is expected that the market will make another 5 waves after a correction ends.
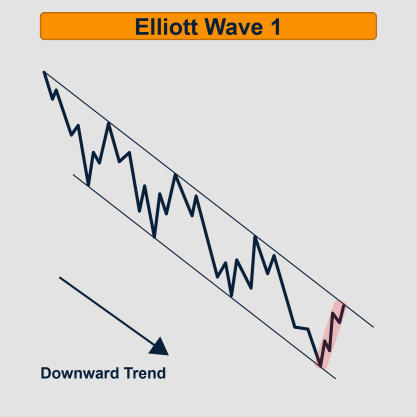
Wave 1
First Impulse wave, it’s the initial start of a new bull run. In a bear market, it’s the initial push downwards from an all-time high.
Wave 2
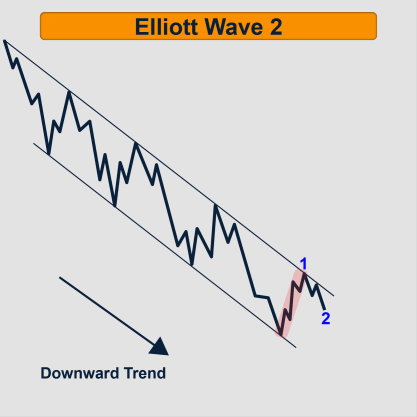
First corrective wave, it’s expected to be in the opposite direction.
Wave 2 is formed due to the selling in bullish trend, or buying in bearish trend. Traders who are selling in the upward trend, don’t realize that this trend is wave 1 but in a new direction.
They also think that wave 1 is another correction in the downward trend and that is why they sell on the top of wave 1.
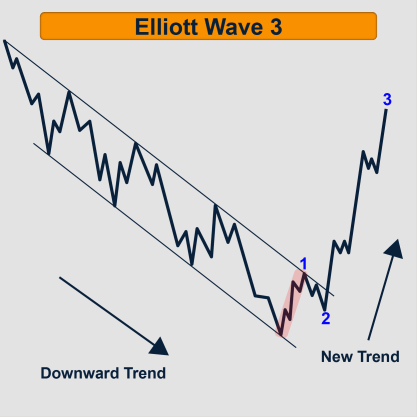
Wave 2 moves in a sharp style and that is why it corrects a big part of wave 1.
Wave 3
Second impulse, is usually the largest and most powerful wave in the trend. The incline and the strong push movement are good indications of wave 3.
Market participants in wave 3 include forex brokers, retail investors, central banks, governments. However, the primary market makers are the large banks that execute a significant amount of the trading volume and provide the baseline exchange rate that all other trade pricing is based on.
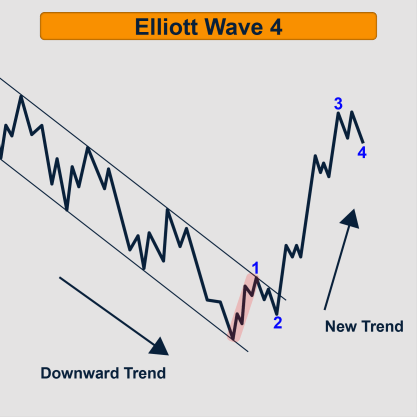
Wave 4
Second corrective wave, it’s another move down in prices and sellers, banks and traders cash in on their profits.
Waves 2 and 4 have different characteristics. They are both corrective waves, but the correction lasts longer in wave 4.
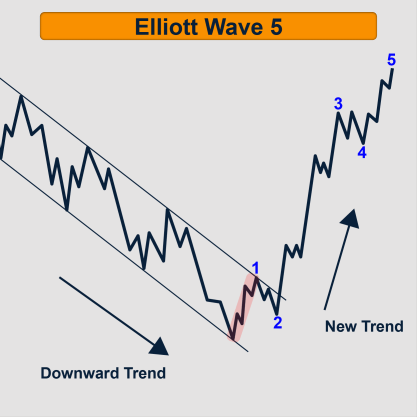
Wave 5
Third and often longest impulse wave, usually banks and investment funds don’t participate here, that is why it may truncate in and it can be in the form of leading diagonal.
What Is Motive Wave In Elliott Wave Theory?
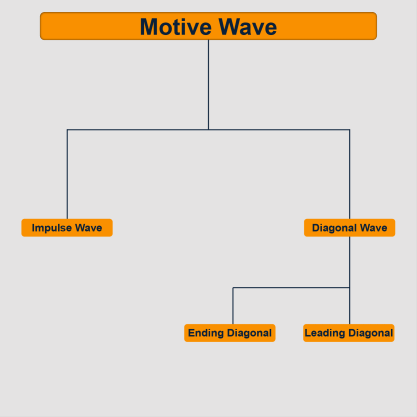
- The motive waves are divided into 2 types:
Motive wave in Elliott Wave theory is the wave that does the action, while the corrective wave is the reaction of the first wave. The motive wave pushes the price in the same direction of the main trend. Motive wave patterns can’t be in the form of 3 waves.
- Impulse wave
- Diagonal waves
- The diagonal waves are divided into 2 types:
- Leading diagonal
- Ending diagonal
Impulse Wave
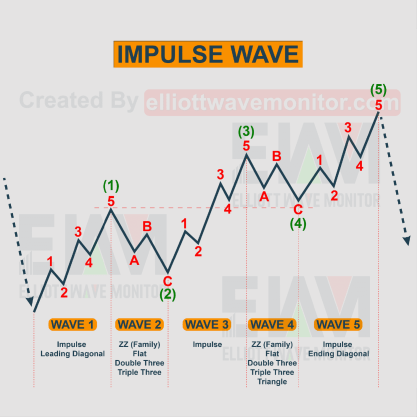
The impulse wave in Elliott Wave Theory is the wave that pushes the prices in the same direction as the trend at one larger degree. It’s the action wave.
While the corrective wave is the reaction to the first wave. Therefore, the corrective wave moves in the opposite direction of the main trend.
The impulse wave is composed of 5 waves according to certain conditions & rules.
Description:
Impulse waves are always composed of five waves, labeled 1,2,3,4,5. Waves 1,3 & 5 are in the direction of the main trend.
Whereas, waves 2 & 4 are in the opposite direction.
Rules & guidelines:
- Wave 1 of the impulse wave is either impulse or leading diagonal.
- Wave 2 must not go beyond the origin of wave 1. (The wave 2 retraces 61.8 Fibonacci of wave 1).
- Wave 3 must not go beyond the top of wave 1.
- Wave 2 and 4 must alternate in the correction pattern, and Wave 2 can’t be in a triangular form.
- Wave 4 can’t overlap wave 1.
- Wave 3 is never the shortest when compared to waves 1 and 5.
- The internal structure of wave 3 must be impulse and can’t be diagonal.
- Wave 1 can be leading diagonal or wave 5 can be ending diagonal, but there must not be 2 diagonal wave in a one wave.
- Wave 5 must not be less than 70 % in length of wave 4.
In which wave:
The impulse wave occurs in waves 1, 3 and 5 and in waves a and c.
Internal Structure:
The impulse wave is composed of five waves. The internal structure of these impulse waves is 5-3-5-3-5.
Extension
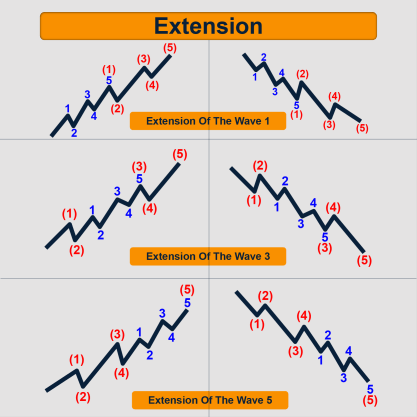
Description:
The extension occurs in an impulsive wave. However, It’s not necessary to be in a certain wave, it can be wave 1, 3, or 5 on condition that this wave is extended.
We realized that wave 5 is extended in commodities & currencies. Whereas, wave 3 is also extended continuously in the stocks & currencies markets on condition that wave 3 shouldn’t be the shortest.
Failure or Truncated 5th
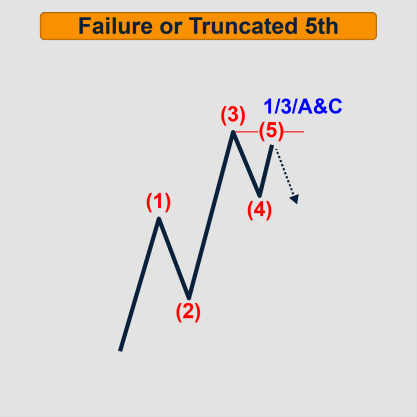
Description:
Truncation is a phenomenon that occurs in hard times, disasters & wars. However, it only occurs in wave 5 whether it is impulsive or diagonal & doesn’t have conditions.
As a result, you can predict it, also you can expect the truncation after wave 3 is greatly extended.
Rules & guidelines:
- The prices must reach 70% of wave 4 before the truncation, & truncation can’t occur without this condition.
- Wave 5 fails to go beyond the origin of wave 3.
- The internal structure should be composed of 5 waves.
Diagonal Wave (Leading Diagonal, Ending Diagonal)
Diagonal Triangle in Elliott Wave Theory is a Motive Pattern, but not an impulse. It replaces the impulse waves at a specific location in the wave structure.
However, the diagonal triangle is the only five wave structure in the direction of the main trend in which wave 4 almost always overlaps wave 1.
Leading Diagonal
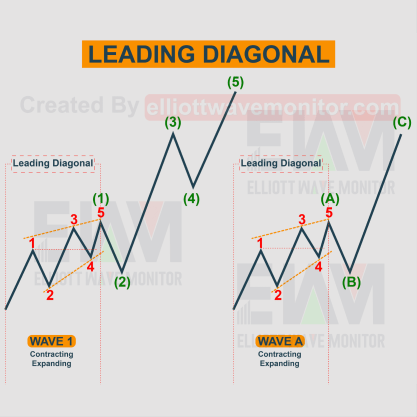
Description:
Leading Diagonal is a sort of impulsive pattern, but it differs in shape and internal structure. However, the leading diagonal occurs in waves 1 or A, & it comes in the form of contracting or expanding diagonal.
Leading diagonal is not in Elliott’s original work, but it appears enough times that we are convinced of its validity.
Rules & guidelines:
- Its internal structure similar to the impulse wave 5-3-5-3-5.
- Wave 4 & wave 1 do overlap.
- The correction of wave 2 is 61.8% in length of wave 1 up to 99%, but it doesn’t go beyond the origin of wave 1.
- The leading diagonal is either contracting diagonal or expanding diagonal.
- Wave 3 can’t be the shortest.
- Wave 2 must not go beyond the origin of wave1.
- Wave 4 must not go beyond the origin the wave 3.
- Wave 1 is the longest, while wave 5 is the shortest in contracting diagonal. On contrary, wave 1 is the shortest and wave 5 is the longest in expanding diagonal.
In which wave:
Leading Diagonal occurs in waves 1 and A.
Internal Structure:
The five waves of the Leading diagonal show an internal structure of 5-3-5- 3-5.
Ending Diagonal
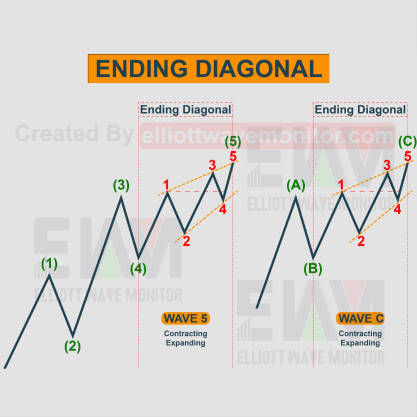
Description:
Ending diagonal in Elliott Wave Theory is a special type of wave, which normally occurs in the 5th wave after a “too far too fast” movement as described by Elliott.
Moreover, ending diagonal occurs in the end of the direction.
However, it doesn’t occur in the beginning or the middle of the direction.
As a result, the appearance of the ending diagonal indicates the approach of a reflection and that is why it’s called ending.
Rules & guidelines:
- It’s the only impulse wave that is composed of 3-3-3-3-3 in its internal structure.
- It must be in contracting or expanding diagonal.
- Wave 1 and wave 4 must overlap.
- Wave 4 must not go beyond the origin of wave 3.
- Wave 2 must not go beyond the origin of wave1.
- Internally all waves of the diagonal have a corrective wave structure.
- Wave 3 of the ending diagonal can’t be the shortest.
- Wave 1 is the longest and wave 5 is the shortest in contracting. However wave 1 is the shortest and wave 5 is the longest in expanding diagonal.
In which wave:
Ending Diagonal occurs in waves 5, C.
Internal Structure:
The internal structure of the five waves is 3-3-3-3-3.
What Is Corrective Wave In Elliott Wave Theory?
Corrective wave in Elliott Wave Theory is a reaction wave, while motive wave is the action wave.
In fact, the corrective wave pushes the price in the opposite direction of the main trend.
However, the correction pattern can never be subdivided into 5 waves, this feature is for motive waves only.
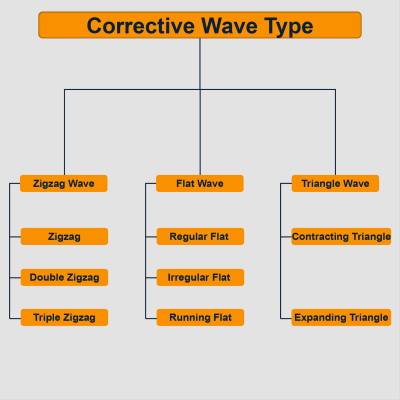
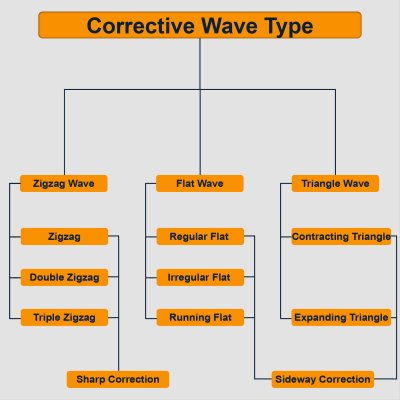
The corrective waves are divided into 3 types. They are all called wave structures.
These types are :
- Zigzag waves (zigzag, double zigzag, and triple zigzag).
- Flat waves (Regular flat, irregular flat, running flat).
- Diagonal triangle (contracting triangle, expanding triangle).
The corrective waves can also be divided in terms of style to Sharp Correction and Sideway Correction.
Zigzag (Zigzag, Double Zigzag, Triple Zigzag)
A zigzag wave in Elliott Wave Theory is the simplest corrective wave. Often it looks like an impulsive wave because it starts with 5.
Zigzag wave moves against the trend and can take the form of Zigzag, Double Zigzag, or Triple Zigzag.
Zigzag
Description:
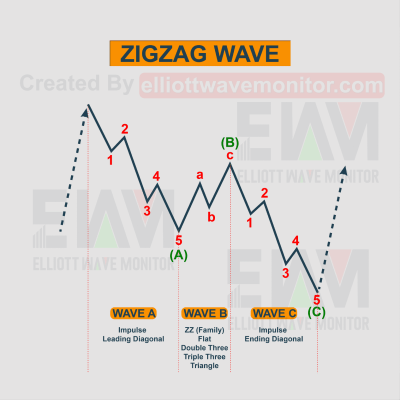
The zigzag wave is a simple traditional pattern of correction that is mentioned by Elliott, and it’s considered the most popular 3 waves corrective pattern labeled as A-B-C.
Whereas A & C are impulses, while the B wave is corrective.
The zigzag wave is known to form a sharp, fast, three-wave corrective pattern. The sub-wave sequence is 5-3-5.
Rules & Guidelines:
- Zigzag has a 5-3-5 inner structure (motive, corrective, motive).
- Wave A can be impulse or leading diagonal.
- Wave B can’t go beyond the origin of wave A, however it can be in any correction pattern.
- Wace C can be impulse or ending diagonal.
- Wave C normally is at least equal to Wave A.
- Wave C must go beyond the end of A.
- Wave B retraces no more than 61.8% of Wave A.
In which wave:
Most of the time it happens in A, X, or wave 2. Also quite common in B waves as a part of a Flat, (part of) Triangles and sometimes in 4.
Internal Structure:
The single Zigzag is composed of three waves. The internal structure of the 3 waves is 5-3-5.
Double Zigzag
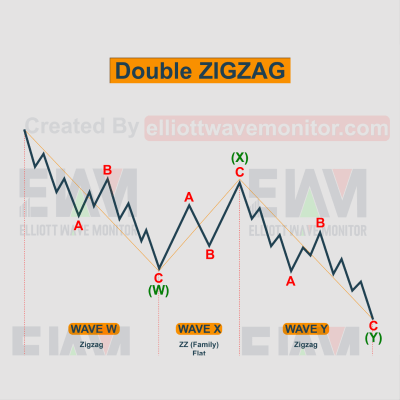
Double zigzag in Elliott Wave Theory is a corrective pattern that contains 2 simple patterns joined together by a connected wave.
In other words, there are 2 zigzag waves joined by a corrective wave and it comes in any pattern.
Rules & Guidelines:
- The double zigzag is composed of 7 waves: 3+1+3.
- The first zigzag wave (A-B-C) is labelled W.
- The second zigzag wave (A-B-C) is called Y and it’s joined with W by a wave called X so we get XYZ.
- Wave X is a simple wave and it comes in any corrective pattern.
- Double zigzag waves apply the rules of zigzag wave.
- Wave X must not go beyond the origin of wave W.
- The Wave Y must go beyond the end of W.
- Wave X retraces no more than 50% of Wave W.
In which wave:
Double zigzag occurs in waves 2 & 4, in B waves, A of flat, triangle, or X.
Internal Structure:
The Double Zigzag is composed of seven waves. The internal structure of the 7 waves is 5-3-5 x 5-3-5.
Triple Zigzag
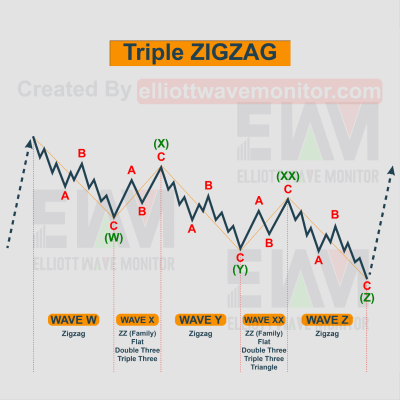
Triple Zigzags in Elliott Wave Theory are corrective patterns that contain 3 zigzag waves connected by 2 joining waves X and XX.
Rules & Guidelines:
- The triple zigzag is composed of 11 waves: 3+1+3+1+3.
- In triple zigzag, there is 3 zigzag patterns, each of them is A-B-C inner structure. However the 3 zigzags are joined by 2 connecting waves and labeled as W-X-Y-XX-Z. The subdivision of wave W, wave Y and wave Z are zigzags.
- X and XX can be any corrective patterns joining the waves W, Y & Z together.
- Wave XX is a simple wave and can be in any corrective pattern.
- Triple zigzags apply the rules of the of zigzag wave.
- The wave XX doesn’t go beyond the origin of Y.
- The Wave Z must go beyond the end of Y.
- Wave XX retraces no more than 50% of Wave Y.
In which wave:
The double zigzags occur in waves 2 & 4, A of flat, triangle, or X.
Internal Structure:
The triple zigzags are composed of 11 waves. The internal structure of 11 waves 5-3-5 x 5-3-5 x 5-3-5.
Triangle (Contracting Triangle, Expanding Triangle)
Triangle pattern in Elliott Wave Theory is a consolidation pattern that connotes the continuation of the existing trend, & it’s considered the most important sideways action.
This pattern indicates that buyers and sellers are equal in strength. Triangles are formed when the market activity is reduced because the direction of the movement is not clear.
During this sideways movement, the volatility also comes down. Since triangles are formed, the volume also falls during this period.
Triangles move within 2 channel lines, first line is from waves A to C, the second line is from B to D.
so a triangle is either contracting or expanding depending on the channel lines if they are converging or expanding.
Triangles occur in waves 4 or B, but they can’t be wave 2.
There are 2 types of triangles: contracting & expanding.
Contracting Triangle
Description:
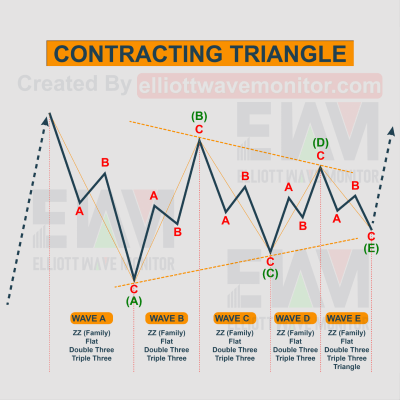
Contracting triangle in Elliott Wave Theory can be viewed when the upper and lower trendlines meet at the apex of the right side forming a corner.
The upper trendline is formed by connecting the highs (could be A-C or B-D), while the lower trendline is formed by connecting lows (could be A-C or B-D). It consists of 5 subwaves that move in the opposite direction to wave A or 3.
Rules & Guidelines:
- It consists of 5 waves marked A-B-C-D-E structured 3-3-3-3-3.
- The 5 waves can be in any corrective pattern.
- Wave A of contracting triangle is always a zigzag based pattern or flat.
- Wave B must be a zigzag based pattern, and it can go beyond the origin of A.
- Waves A or B is the longest.
- Wave C never move beyond the end of wave B.
- Wave D must not go beyond the end of wave C.
- Wave E doesn’t go beyond the end of wave D.
- The 2 trendlines A-C and B-D are contracting and can’t be parallel.
In which wave:
Triangles occur only in waves B, X & 4. Never in wave 2 or A.
Internal Structure:
The Triangle is composed of 5 waves. The internal structure of the 5 waves is 3-3-3-3-3.
Expanding Triangle
Description:
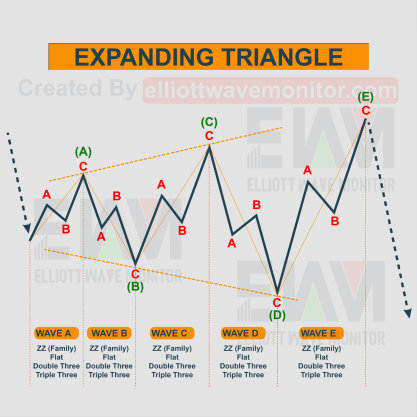
Expanding triangle in Elliott Wave Theory is the same as the contracting triangle.
it is a sideways movement and consists of 5 waves labeled A-B-C-D-E, structured 3-3-3-3-3. The only difference is that the trendlines are expanding and not contracting.
Rules & Guidelines:
- The 5 waves of the triangle can be in any corrective pattern.
- Wave A of triangle must be a zigzag based pattern, and it’s the shortest.
- Wave A is the shortest, while wave E is the longest.
- Wave C must be beyond the origin of wave B.
- Wave D must be beyond the origin of wave C.
- Wave E goes beyond the origin of wave D.
- The 2 trendlines A-C and B-D are expanding and can’t be parallel.
In which wave:
Triangles occur only in waves B, X & 4. Never in wave 2 or A.
Internal Structure:
The Triangle is composed of 5 waves. The internal structure of the 5 waves is 3-3-3-3-3.
Ascending Triangle
Ascending triangles in Elliott Wave Theory are a bullish formation, and similar to the symmetrical triangle except that the upper trendline is flat and the lower trendline is rising.
Descending Triangle
Descending triangles in Elliott Wave Theory are a bearish formation. However, the descending triangle is the upside-down image to the ascending.
It is characterized by a descending upper trendline and a flat lower trendline.
Symmetrical Triangle
Symmetrical triangles in Elliott Wave Theory differ from ascending and descending triangles in that the upper trendline and lower trendline slope toward a center point.
In a bullish symmetrical triangle, the continuation chart pattern is bullish and the movement preceding the triangle’s formation must be bullish too.
In a bearish symmetrical triangle, the continuation chart pattern is bearish and the movement preceding the triangle’s formation must be bearish too.
Running Triangle
A running triangle in Elliott Wave Theory, as its name suggests, ends above the starting point if it’s bullish, or below the starting point if it is bearish.
it is composed of 5 waves A-B-C-D-E, whereas wave B always runs beyond the origin of wave A.
According to Elliott Waves theory, running triangles are often found at the end of wave 2 in impulsive structure.
Flat (Regular Flat, Irregular Flat, Running Flat)
A flat in Elliott Wave Theory differs from a zigzag wave in that the sub-wave sequence is 3-3-5, where wave A is made up of 3 sub-waves labeled as A-B-C and not a 5 full waves as it does in zigzag.
Wave A of zigzag can be impulsive or leading diagonal, while wave A of flat could be any corrective pattern except triangles.
Flats are 3 wave corrective pattern labeled A-B- C but it moves in a sideways manner.
There are essentially 3 types of flat corrections: regular, expanded and running. However, the most common type is the expanded, while running is rare.
Regular Flat
Description:
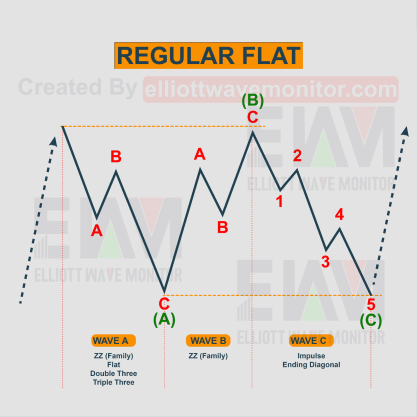
Regular in Elliott Wave Principle is made up of 3 sub-waves. Waves A & B of flat are both corrective patterns, while wave C is an impulsive pattern.
its internal structure is 5-3-3.
The edges of waves A & B are equal, while wave C ends slightly past the end of A which generally shows a sideways direction.
Guidelines & Rules:
- Wave A can be in any corrective pattern except triangles.
- Its internal structure is 5-3-3 (corrective, corrective, motive).
- Wave B of regular flat doesn’t go beyond wave A. Wave B can be in any corrective pattern (except triangles) and it must retrace more than 70% of wave A.
- Wave C is impulsive or ending diagonal.
In which wave:
Flat occurs mostly in B waves, though also quite common in 4 and 2.
Internal Structure:
As mentioned before a flat consists of 3 waves. Also, the internal structure of these waves is 3-3-5.
Expanded Flat or Irregular Flat
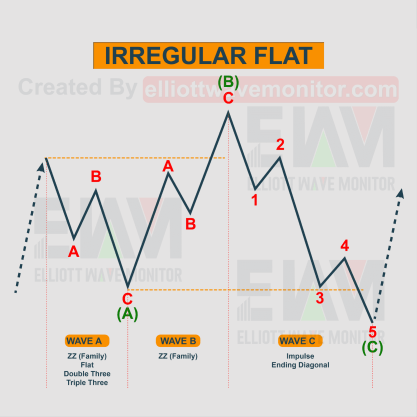
Description:
The irregular flat in Elliott Wave Principle differs from the regular in that wave B extends & ends beyond the start of wave A. Also, wave C ends beyond the end of wave A.
Guidelines & Rules:
- Its internal structure is also 5-3-3. Waves A & B are corrective patterns while wave C is impulsive pattern.
- Wave A must be any corrective pattern (except triangles).
- Wave B must go beyond the origin of wave A, also it can be in any corrective pattern except (triangle).
- Wave C can be impulsive or ending diagonal.
- Wave C must go beyond the end of wave A.
In which wave:
This corrective pattern can happen in 2, 4 & B.
Internal Structure:
It is composed of 3 waves, which have an internal structure of 3-3-5.
Running Flat
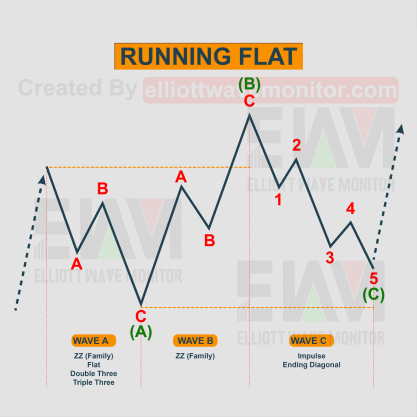
Description:
Running flat in Elliott Wave Principle is similar to irregular flat in that wave B must go beyond the origin of wave A.
However, they differ in that wave C ends substantially beyond the end of wave A.
Guidelines & Rules:
- Its internal structure is also 5-3-3. Waves A & B are corrective patterns while wave C is impulsive pattern.
- Wave B goes beyond the origin of A.
- Wave C doesn’t go beyond the origin B nor the end of A.
- Wave A must be in any corrective pattern except (triangles).
- Wave C can be impulsive or ending diagonal.
- Wave C must not go beyond the end of wave A.
- Wave B goes beyond the origin of A. Wave B can be in any corrective pattern except (triangles).
In which wave:
Most of the time it occurs in waves 2, 4 & B waves.
Internal Structure:
It is a three-wave structure. The internal structure is 3-3-5.
Complex (Double Three, Triple Three)
Complex correction in Elliott Wave Principle is a sideways corrective pattern that consists of 2 or 3 corrective patterns.
Elliott called these sideways corrections as double threes and triple threes.
A double three combination in Elliott Wave Principle includes 2 corrective waves, the first one is marked as W and the second one is marked as Y. These 2 waves are linked by X wave.
A triple three combination in Elliott Wave Principle consists of 3 corrective waves labeled as W, Y, & Z, each linked by X waves.
Each corrective pattern is linked by an X wave, which has 3 characteristics: it can be any corrective pattern (zigzag, flat, or triangle), it moves in the opposite direction to the previous corrective wave and it’s usually a zigzag.
Double Three
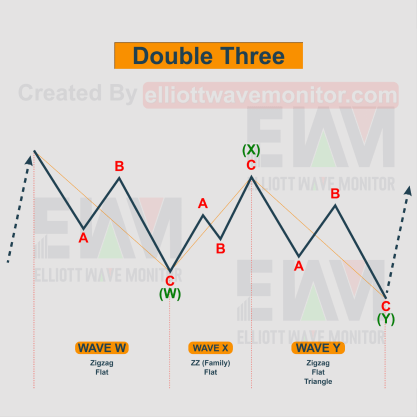
Description:
Double three in Elliott Wave Principle is a combination of 2 corrections of different types (including all various types of zigzags, flats, and triangles) joined together by a connected wave W-X-Y.
Whereas, wave X can take the shape of any corrective pattern but is most commonly zigzags. However, the double three almost always ends with a triangle.
The only possibilities of the double three are the following:
- Zigzag X triangle: this double combination ends with a triangle, very common. The whole pattern is compete. Zigzag X triangle has the following structure A-B-C –X -A-B-C-D-E.
- Zigzag X flat: this is a rare combination and has a structure of A-B-C-X-A-B-C.
- Flat X flat: this double combination has a structure of A-B-C-X-A-B-C.
- Flat X zigzag: this possibility of the double three is also rare, and has a structure of A-B-C -X -A-B-C.
- Flat X triangle: this double combination also ends with a triangle, very common as well. The only difference between the Zigzag X triangle and the flat X triangle in that the wave A is a correction wave, wave B retraces more than 61.8% of wave A.
Rules & Guidelines:
- Zigzags and triangles can be once in the double three, while flats can be more than once.
- Triangles can be in Y waves, but it can’t be in wave W.
- Wave W of double three must be zigzag or flat but can’t be triangle.
- Wave X can be in any corrective pattern.
- Wave Y can be zigzag, flat or triangle.
- Wave X must be 50% in length from wave W.
- Wave Y retraces 61.8% from wave W if it’s a triangle, otherwise it retraces 100% from wave W.
In which wave:
Double three commonly occur in waves 4, B, or X, and is less common in wave 2 or A of flat.
Internal Structure:
The Double Three is composed of 3 waves.
Triple Three
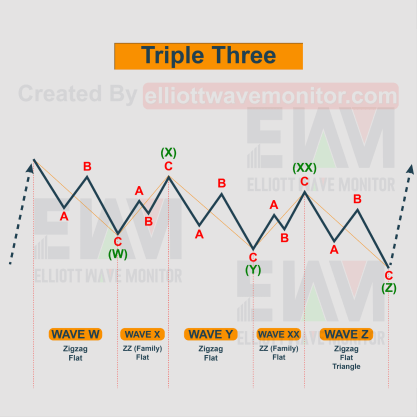
Description:
Triple three in Elliott Wave Principle are quite rare, as its name suggests, has 3 corrective waves, connected by 2 waves X & XX.
These are labeled as A-B-C-X- A-B-C-X- A-B-C abbreviated as W-X-Y-XX-Z.
Flats can occur more than once in triple three, while triangle can occur once and it comes in wave Z.
Whereas, zigzags also occur once in triple three and they often come in wave Y or Z. however, it can be at the begging of the corrective wave in wave W.
There are 7 possibilities for the triple three waves:
- Zigzag X flat X flat
- Zigzag X flat X triangle
- Flat X flat X flat
- Flat X flat X zigzag
- Flat X flat X triangle
- Flat X zigzag X flat
- Flat X zigzag X triangle
Rules & Guidelines:
- Zigzags and triangle occur once in triple three.
- Triangles can be in wave Z, but can’t be in wave W or Y.
- Wave W can be zigzag or flat but not triangle.
- Wave X of triple three can be in any corrective pattern.
- Wave Y can be zigzag or flat, but not triangles.
- Wave XX can be in a corrective pattern.
- Wave Z can be zigzag, flat or triangle.
- Wave X must retrace 50% in length from wave W.
- Wave XX must retrace 50% from wave Y.
- Wave Z commonly retrace 61.8% from wave Y, otherwise it retraces 100%.
In which wave:
Triple three normally occur in waves 4, B, or X.
Internal Structure:
The triple three is composed of 5 waves.
Channeling In Elliott Wave Theory
Channeling in Elliott Wave Principle is an important tool to project the end of the waves.
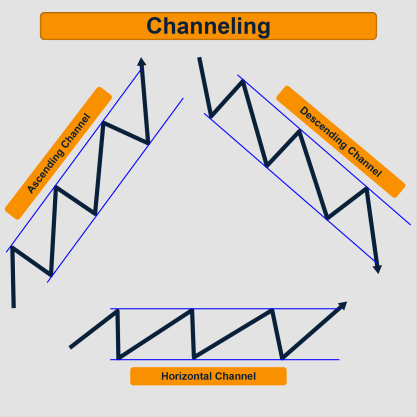
it is a price movement between two parallel lines in which these lines are drawn from tops or bottoms, there are three types of channels:
Ascending Channel, Descending Channel, & Horizontal Channel:
Price Movement Prediction Using Channeling
Elliott Wave Theory rules suggest that wave 5 in the motive pattern is almost always equal to wave 1 in price and time in case wave 3 is extended and that is why a channeling wave is drawn.
The lower limit is this channel is called “wave trend or wave direction”.
The channel is considered as a main tool in predicting the direction or the change of the trend and in determining the purposes of the impulse waves.
Drawing Channels For Impulse Wave
Drawing a channel for an impulsive wave requires at least 3 points. When wave 3 ends we trace the upper line connecting the top of wave 1 and wave 3.
After that, we trace a parallel line (lower line) at the end of wave 2. This channel provides us the limits of the expected wave 4.
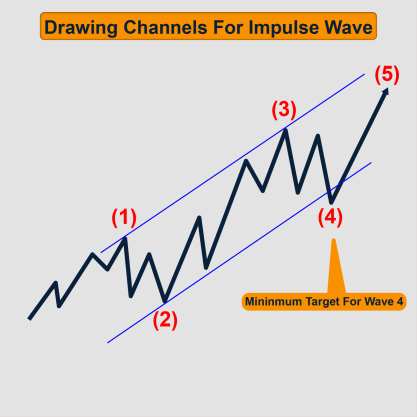
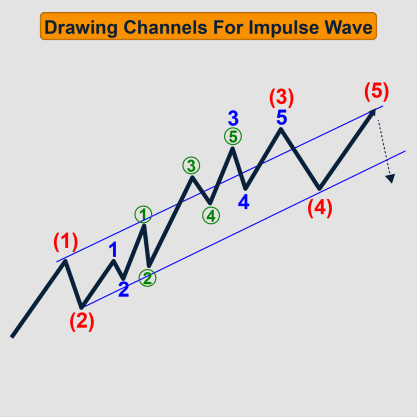
If wave 4 ends at a point that isn’t on the parallel. We have to re-trace the channel in order to predict the limits of wave 5.
So we have to draw a line connecting waves 2 and 4. Wave 3 is almost always an extended wave with respect to waves 1and 5.
Drawing Channels For Corrective Wave
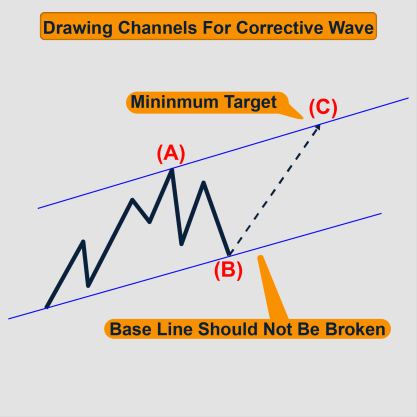
When waves A and B end, we can trace the lower line connecting the origin of wave A and the end of wave B.
After this, we trace a parallel line which is the upper line from the top of wave A. this channel is useful to predict the end of wave C.
Drawing Channels For Complex Wave
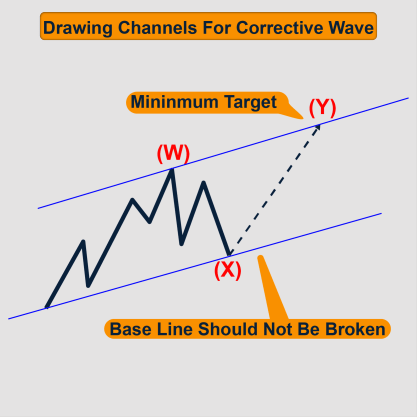
When waves W and X end, we can trace the lower line connecting the origin of wave W with the end of wave X.
after this, we trace a parallel line which is the upper line starting from the top of wave W. this channel is useful to predict the end of wave Y.
Fibonacci Ratios In Elliott Wave Theory
Fibonacci Ratio in Elliott Wave Theory refers to the relation of the wave and the one that precedes it.
It’s one of the main tools that are used in measuring the target of the wave’s move is within an Elliott Wave structure.
Leonardo Fibonacci
Leonardo Fibonacci also known as Fibonacci, Leonardo Bonacci, Leonardo Of Pisa and Leonardo Bigollo Pisano is a mathematical scientist, who introduced the Hindu-Arabic place-valued decimal system and the use of Arabic numerals into Europe in his book “Liber Abaci”.
He is best known by the Fibonacci sequence, though, for his introduction into Europe of a particular number sequence, which has since become known as Fibonacci Sequence or Fibonacci numbers, although the sequence had been described earlier in Indian mathematics and in Egyptian civilization.

Leonardo Series
Fibonacci summation series is a series that takes 0 and adds 1 as the first 2 numbers. Thus the follow-up number is the series is the sum of the 2 preceding numbers.
(1+ 0 = 1), (1 + 1 = 2), (1 + 2 = 3), (2 + 3 = 5), (3 + 5= 8), (5 + 8 = 13),
(8 + 13 = 21), (13 + 21= 34), (21 + 34 = 55), (34 + 55 = 89) ……
If we start at 0, & then we go to the next whole integer number which is 1, and add 0 to 1, that gives us a sum of 1.
So If we take that 1 and add it to the previous number which is 1, so we have a sum of 2.
If we add 2 to its previous number which is 1, then 2 plus 1 gives us 3.
If we take 3 and add it to the previous number 3, then 2 plus 3 gives us 5 and so on.
Thus we have 0,1,1,2,3,5,8,13,21,34,55,89,144 …… and this series of numbers is called Fibonacci sequence.
Why Fibonacci Sequence Is So Important For Technical Analysis?
We can use the Fibonacci sequence in golden ratios, which is the relation between any 2 consecutive numbers in the sequence.
For example, number 2 represents 66.6% of number 3, number 3 represents 60% of number 5 and number 8 represents 61.5% of number 13, the average golden ratio is 61.8%, which is the quotient of dividing a small number by a big number.
What Is The Golden Ratio?
The Golden ratio sequence is the relation between the number and the number that precedes it.
For example, number 5 represents 1.666% of number 3, number 89 represents 1.618% of number 55.
So the relation between the big number and the small number is that the big number represents 1.618% in average of the number that precedes it in the Fibonacci sequence and it represents 61.8% of the next number in average.
This is the golden ratio that is considered to be very helpful in technical analysis.
Relation Between Elliott Wave Theory And Fibonacci Numbers
With going back to the traditional pattern of waves, we see that the sum of two consecutive numbers is a number in the Fibonacci sequence.
Wave1 + wave 2 = wave 3 and wave 2+ wave 3 = wave 5, also the sum the 5 waves in the same trend direction and 3 corrective is 8 waves.
So, numbers from the Fibonacci sequence are repeated in Elliott wave structure, including motive waves (1, 3, and 5) and a single full cycle (8 waves).
Elliott concluded that the Fibonacci sequence denotes the number of impulse and corrective waves.
Also, wave relationships in price and time are commonly exhibit Fibonacci rations. For example, wave 2 is typically 61.8% of wave 1, wave 4 is typically 38.2% of wave 3.
Elliott Wave Theory Measurements
- Impulse Wave Measurements Using Fibonacci
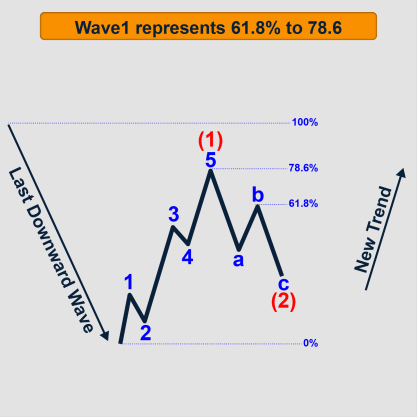
Wave1 represents 61.8% to 78.6 from the last downward wave.
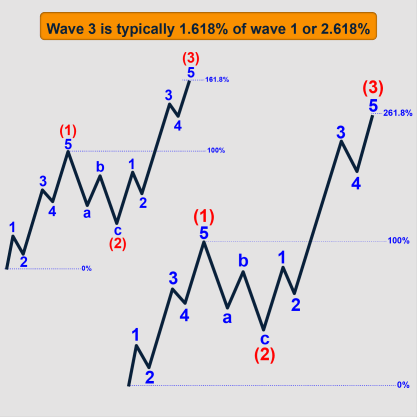
Wave 3 is typically 1.618% of wave 1 or 2.618% if the wave is extended.
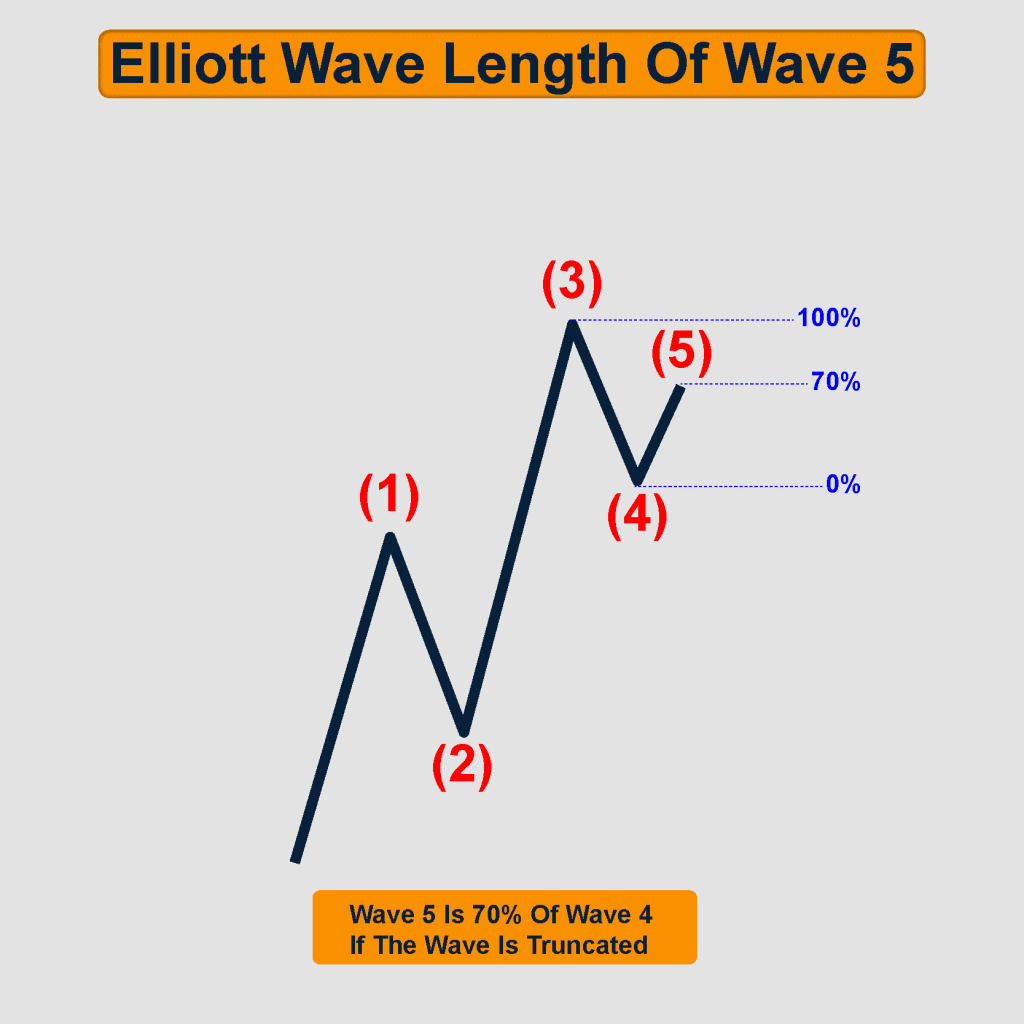
Wave 5 is typically 1.618% of wave 4 if the wave is not truncated.
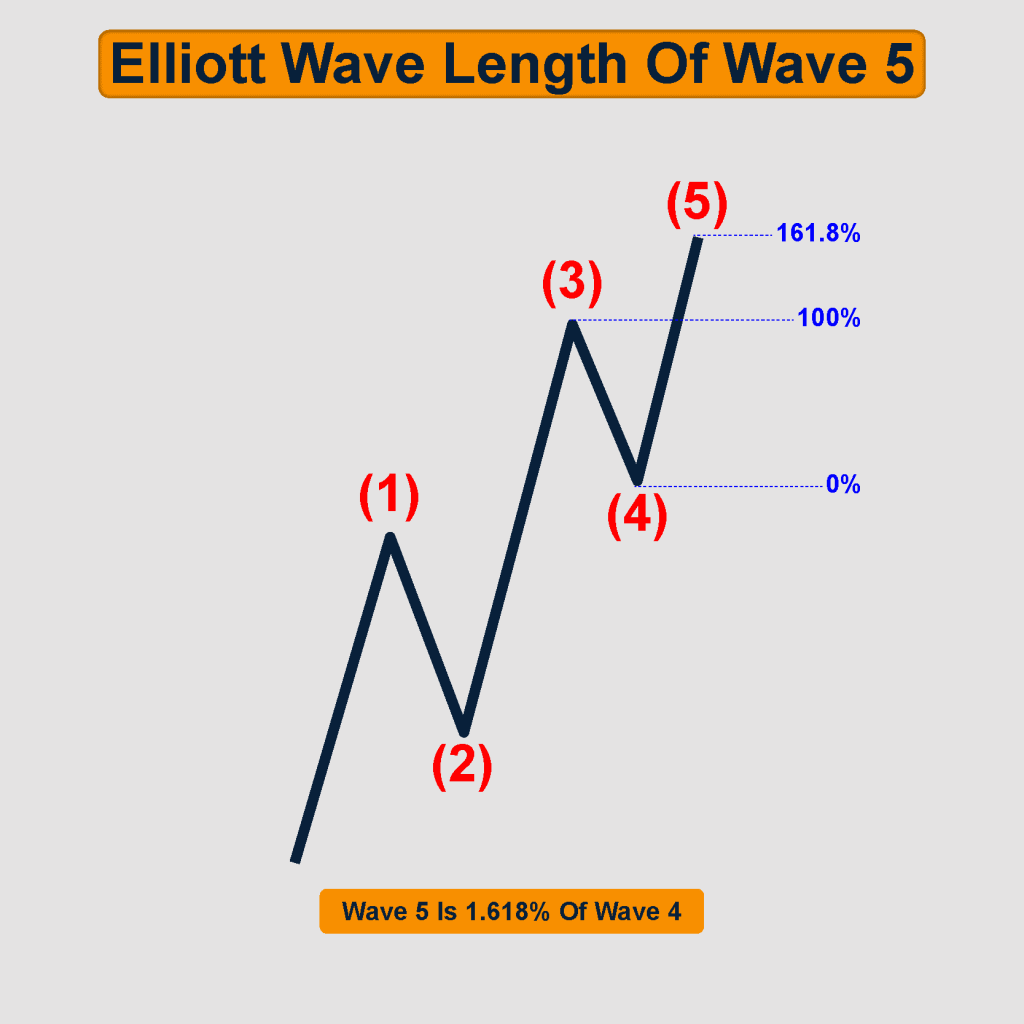
And not less than 70% of wave 4 if the wave is truncated.
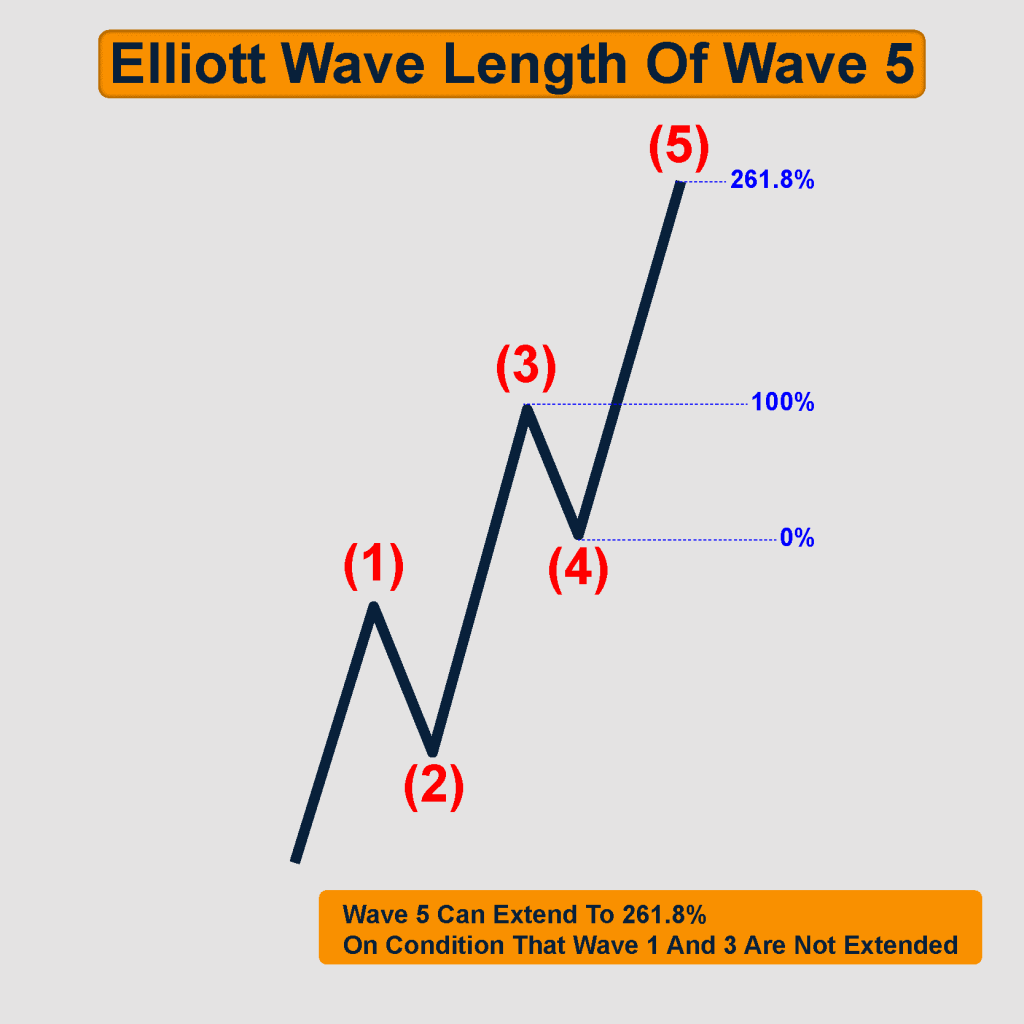
Wave 5 can extend to 261.8% on condition that waves 1 and 3 are not extended.
In a motive wave, only one wave can be extended either wave 1, 3 or 5. Wave 3 is usually extended in stocks and currencies markets, while wave 5 is usually extended in commodities and metals markets.
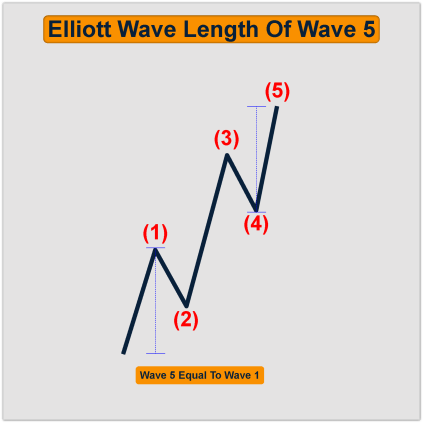
The known ratio for wave 5 is that it is approximately equal to wave1 in price on condition that wave 3 is extended.
- Leading And Ending Diagonal Measurements Using Fibonacci
The Wave 3 is extended from 1.382% to 161.8 % of wave 1 in leading and ending diagonal.
Wave 5 is typically 1.618% of wave 4.
- Corrective Wave Measurements In Motive Waves
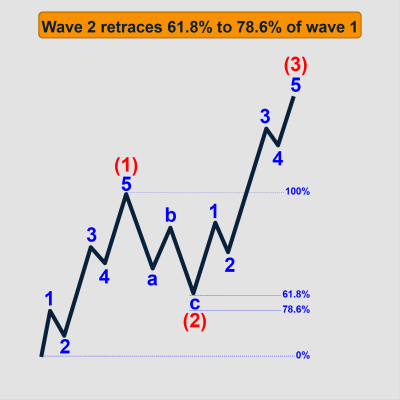
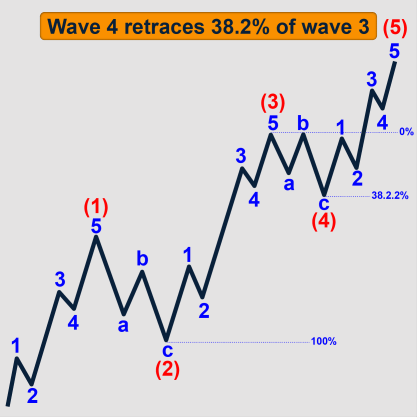
Wave 2 of motive often retraces 61.8% to 78.6% of wave 1 on condition that it doesn’t break wave 1.
If wave 1 is extended, it can be a warning for a strong trend and wave 2 can retrace no more than 50% of wave 1 and the correction can end on 38.2% of wave 1.
Wave 4 in motive often retraces 38.2% of wave 3.
- Correction Patterns Measurements Using Fibonacci
Zigzag Wave
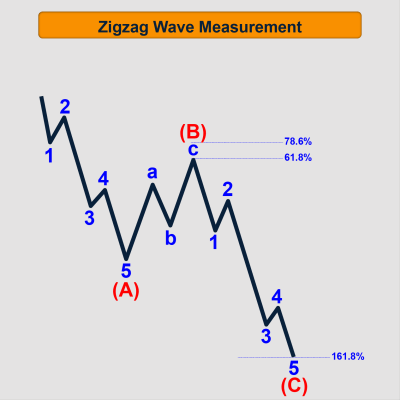
- Wave A is often 50% – 61.8% relative to the size of wave 5 that precedes it.
- Wave B of zigzag retraces 38.2% to 61.8% of wave A, on condition that wave B doesn’t go beyond A.
- Wave C of zigzag represents 138.2% to 161.8% of wave A.
- Wave X is 50% relative to wave W, on condition that wave X doesn’t go beyond the origin of wave W, the same thing is applied to wave XX.
- Wave Y represents 138.2% & 161.8% of wave W, the same thing is applied to wave Z.
Flat Wave
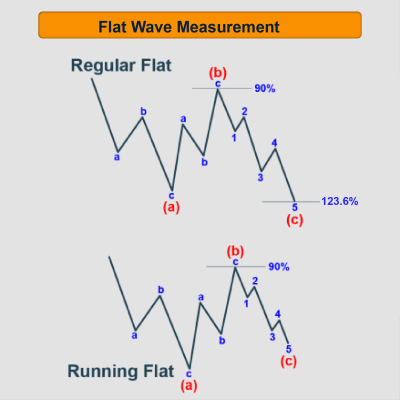
- Wave A of flat retraces 38.2% to 50% of the previous wave, and it can reach up to 61.8%.
- Wave B is typically 90% in regular flat and it can reach up to 100%.
- Wave B retraces 200% in irregular flat, and it can reach 138.2% in running flat.
- Wave C must reach at least 100% of wave A, up to 123.6% or 161.8% in regular flat.
- Wave C must reach at least 100% of wave A up to 300% in irregular flat.
- Wave C of running flat can’t go beyond the origin of wave A.
Triangle Wave
- Contracting Triangle
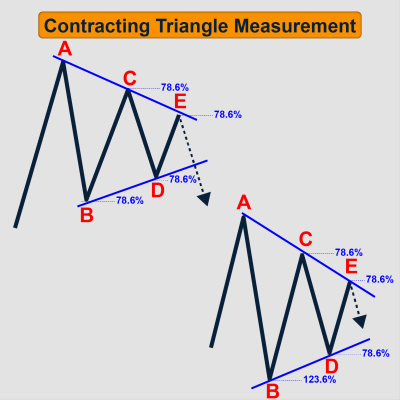
- Wave A is typically 38.2% of the last downward wave in contracting triangle.
- Wave B is typically 78.6%, and sometimes up to 123.6% of wave A in contracting triangle.
- Wave C is typically 78.6% of wave B in contracting triangle.
- Wave D is typically 78.6% of wave C in contracting triangle.
- Wave E is typically 78.6% of wave D in contracting triangle.
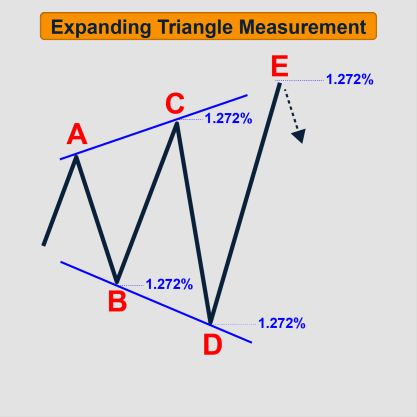
- Expanding Triangle
- Wave A represents 38.2% of the last downtrend wave in expanding triangle.
- Wave B represents 1.272% of wave A in expanding triangle.
- Wave C represents 1.272% of wave B in expanding triangle.
- Wave D represents 1.272% of wave C in expanding triangle
- Wave E represents 1.272% of wave D in expanding triangle.
