
Pin bar or candlestick hammer is a type of reversal candlestick pattern that appears when the price opens and closes approximately in the same area.
Hammer candle is characterized by its tail that is triple the size of the body and a small body as compared to the tail.
The hammer and hanging man are identical in shape but differ in their indications, This difference is due the previous price movement.
- There are 2 types of pin bar: The bullish pin bar and the bearish pin bar

What Is A Bullish Pin Bar?
The bullish pin bar candlestick appears at the bottom of a downtrend and signals a potential bullish reversal.
The hammer appears when sellers are trying to push the price lower, where prices fall during the speculation period, but buyers reject the price.
The Bullish Pin Bar Candlestick Is Made Up Of :
- small body (any color)
- long lower shadow which indicates that buyers are trying to push the market upward
- little or no upper shadow

Look at the above figure, the market is in a bearish trend, the formation of the bullish hammer candlestick is a signal for a bullish reversal.
Sellers are trying to push the market downward, but buyers reject it. (Buyer power is greater than seller power)
How Do You Know If Hammer Is Valid?
If the Hammer appears in the downtrend, followed by a long candle signals a buying power and closed higher than the pin bar then it’s considered a strong signal for the end of the downtrend.
Note: The longer the wick of the hammer, the stronger” the price rejection. The color of the candlestick doesn’t matter, however, if the color is positive, it indicates a high purchasing power.
Trading The Hammer In The Trend
- After drawing the Trend line on the chart, and you found that the direction is uptrend, then you will seek for buying chances.
- Support & resistance: after the price penetrates the resistance level, it becomes support level, and tests it before resuming the upward movement.
- Hammer rejects supports level.

Trading Hammer In The Sideways Channel
When the market swings and moves in sideways direction, where resistance level at the top and support level at the bottom.
We seek for the bullish pin bar when the price touches the lower boundary of the sideways channel or the support level.

Trading Hammer In Elliott Wave Principle
When you see 5 waves on the 5 min time-frame chart, they constitute wave 1 on the hourly chart (wave degree). In this case, you have to wait for the correction of wave 2.
The bullish pin bar is formed at 50% and 61.8 % retracement of wave 2 and it’s a strong sign for a bullish trend (wave 3).

What Is A Bearish Pin Bar?
The inverted hammer represents a potential reversal in an uptrend, it indicates that buyers have lost their strength.
The bearish pin bar appears when buyers are pushing the price higher, whereas prices rise during the speculative period but this rise is rejected by the sellers.
The Bearish Pin Par Candlestick Is Made Up Of :
- small body (any color)
- long upper shadow which indicates that sellers are pushing the market downward
- little or no lower wick (Shadow)
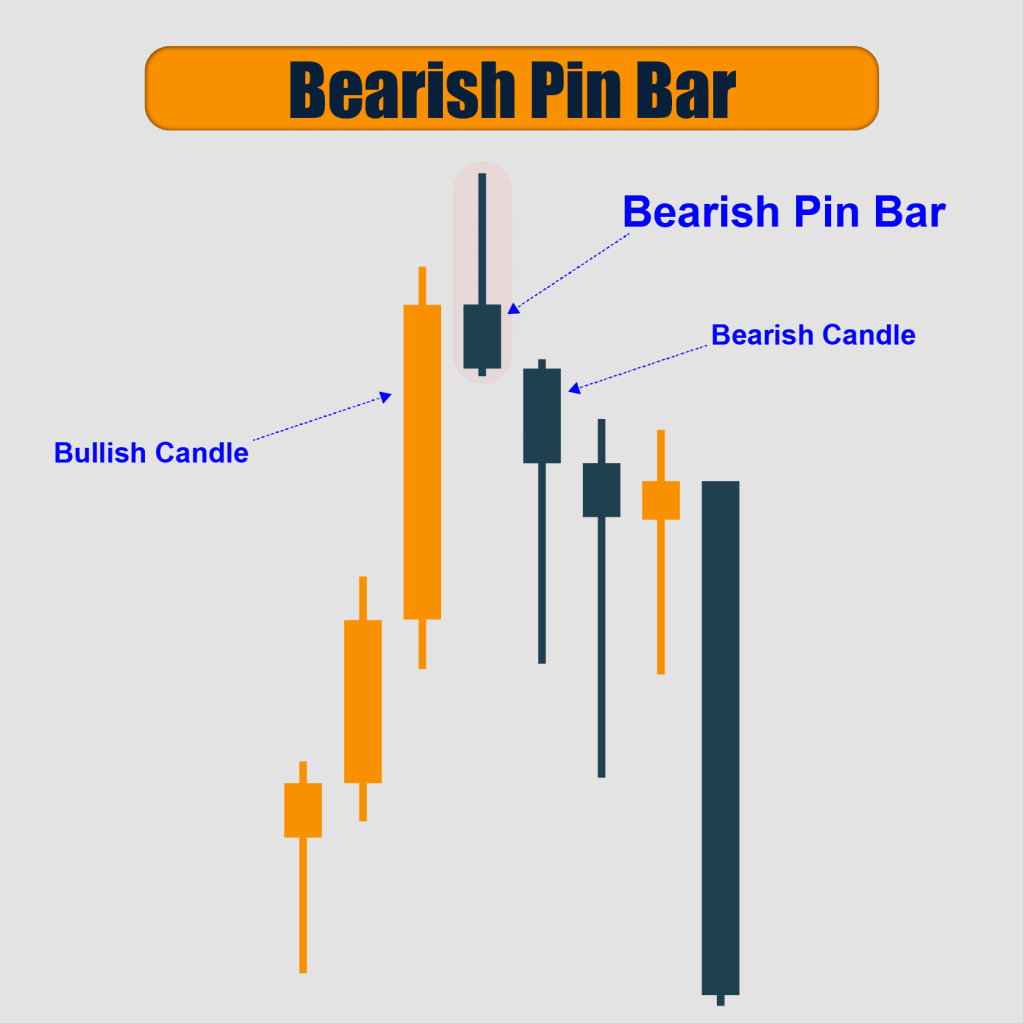
Look at the above figure, as you see the market is in a bullish trend, the formation of a bearish pin bar was a declining reversal pattern.
Buyers are trying to push the market upward, but the sellers reject it. (Seller power is greater than buyer power).
How Do You Know If Inverted Hammer Is Valid?
If the inverted hammer appears at the end of a bullish trend, followed by a long candlestick signals a selling power and closed lower than the pin bar, then it’s considered a strong signal for the end of the bullish trend.
Note: The longer the wick of the inverted hammer, the more credible and effective the inverted hammer is. The color of the candlestick doesn’t matter
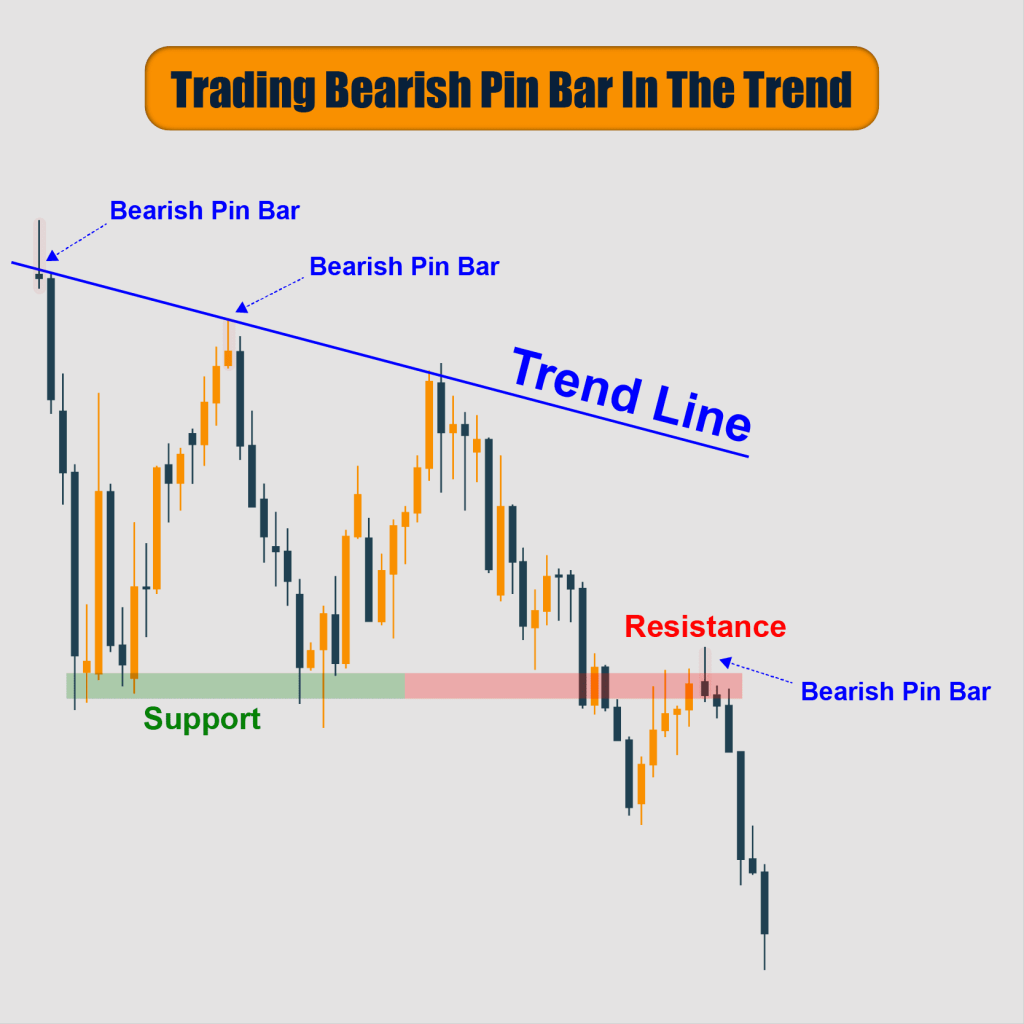
Trading Bearish Pin Bar In The Trend
- After drawing the direction line on the chart, and you found that it’s a downward direction, you will seek for selling chances only.
- Support & resistance levels: after the price penetrates the support level, it becomes resistance level and tests, before resuming its downward movement,
- The inverted hammer rejects the resistance level.
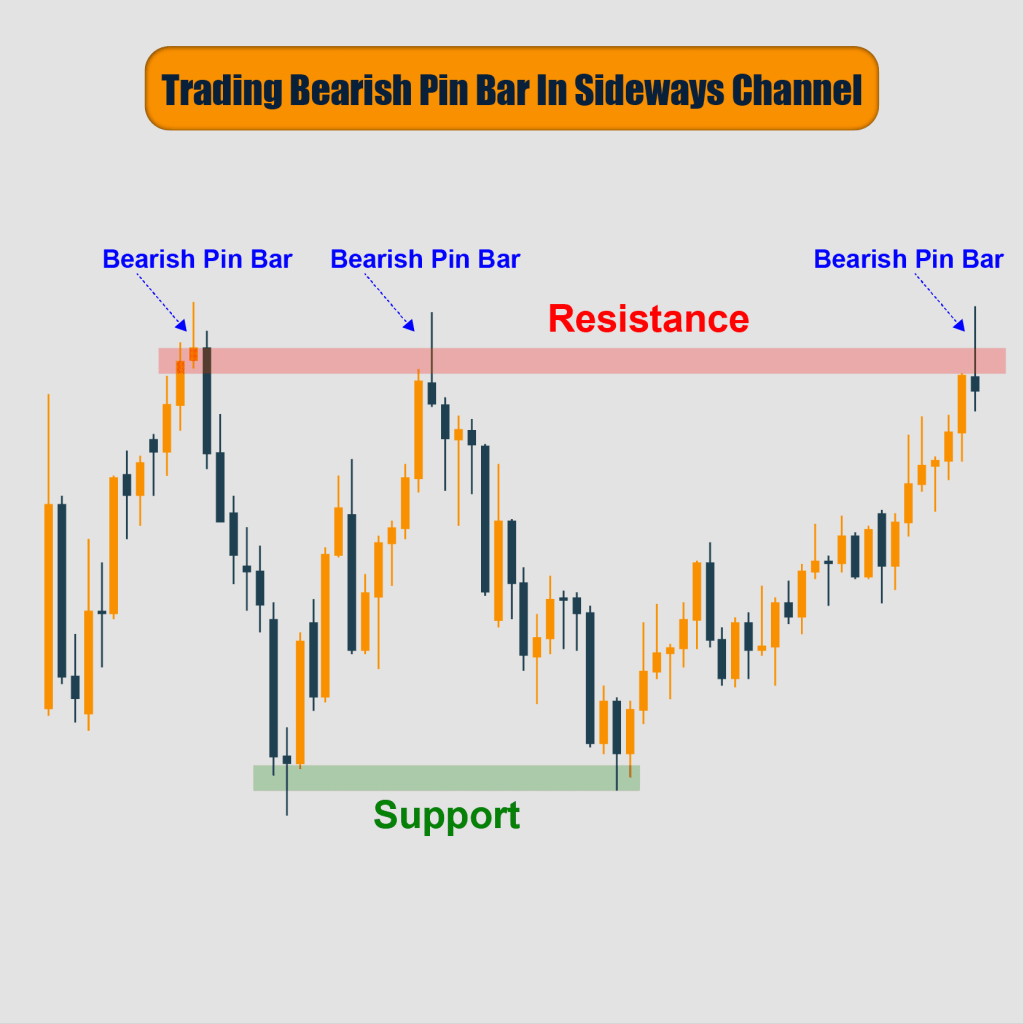
Trading Bearish Pin Bar In Sideways Channel
When the market swings and moves sideways, the resistance area is formed at the top and support area at the bottom, here we can seek for the inverted hammer when the price touches the upper boundary of the sideways channel or the resistance level.
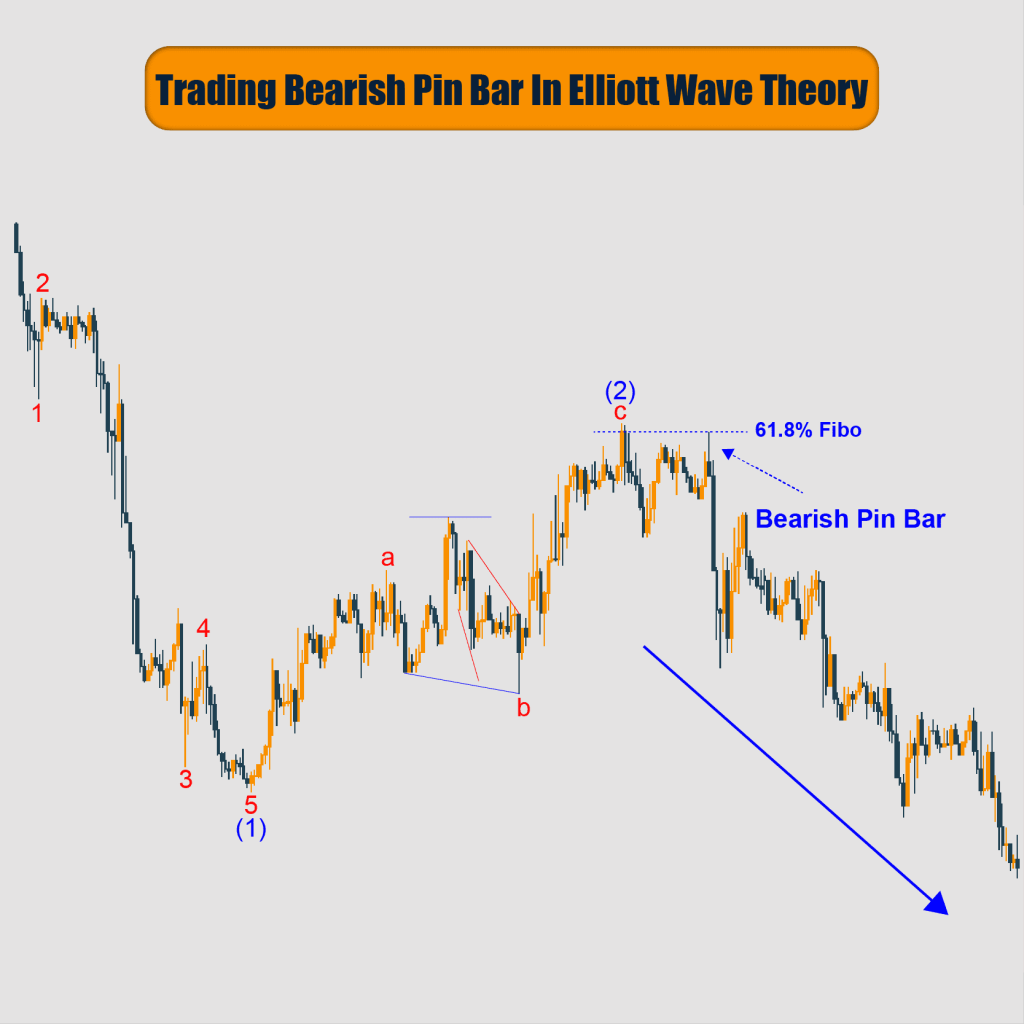
Trading Bearish Pin Bar In Elliott Wave Theory
When we see 5 waves in the downtrend direction on the 15-min chart which constitute wave 1 on the hourly frame (wave degree), here we have to wait for the correction of wave 2.
The bearish pin bar is formed at 50% and 61.8 % retracement of wave 2 and it’s a strong sign for a bearish wave (wave 3).
Finally, the pin bar is a form of a single candlestick, it’s undecided and shows a terrible battle between bulls and bears.
Experience has proven that it’s an entry for banks and investment funds, so it’s preferable to use other tools as Elliott Wave to be sure of it.