
WTI Rate
WTI crude is trading around $89.60 on the 4-hour chart, remaining under pressure after falling below $90. In Monday’s session, WTI was down about 1% near $90.22 as higher Middle East crude exports and the planned release of G7 emergency stocks improved the near-term supply picture. Geopolitical risks, however, continue to limit the downside.
WTI Elliott Wave Analysis, Chart and Forecast
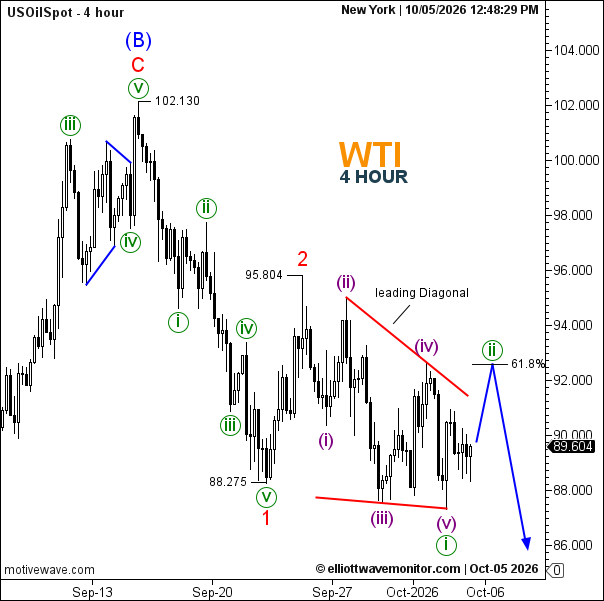
WTI Chart: The Elliott Wave structure remains bearish. Wave (B) completed near 102.130, followed by a five-wave decline that terminated wave 1 at 88.275. The subsequent recovery reached 95.804, completing corrective wave 2.
From that high, wave (i) is developing as a leading diagonal, with its internal waves (i)-(ii)-(iii)-(iv)-(v) visible inside converging boundaries. Wave (v) appears complete near the latest low, suggesting wave (i) may now be finished.
WTI Forecast: A corrective wave (ii) rebound is therefore possible, with the 61.8% Fibonacci retracement near $92.50 representing an important reaction zone. This recovery would remain corrective while below 95.804. Once wave (ii) is complete, the primary count favors a stronger decline in wave (iii), with 88.275 becoming the first major downside reference before the $86 region.
WTI News: OPEC+ kept November production targets unchanged at its October 4 meeting. For the near-term oil outlook, traders are also watching Middle East export flows and security risks around energy infrastructure and maritime routes, which OPEC itself identified as sources of market volatility.