
Gold Price Forecast for October 5, 2026
GOLD Rate
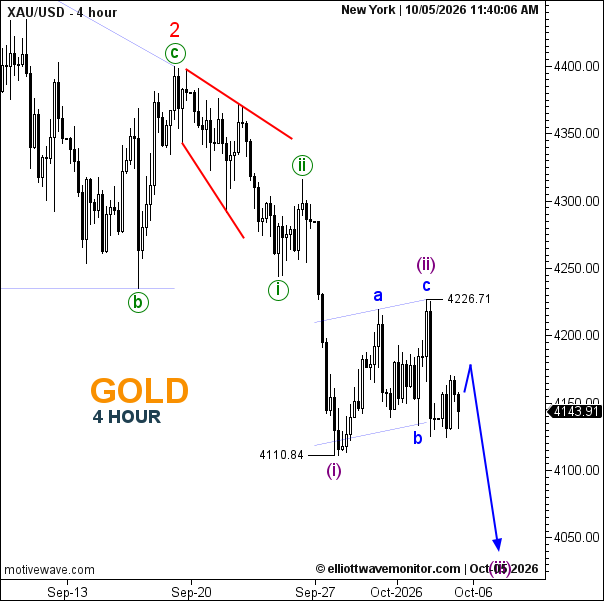
Gold is trading near $4,144 on the 4-hour chart. Spot gold was modestly higher earlier in Monday’s session after weaker U.S. employment data sharply reduced expectations for an October Federal Reserve rate increase. However, the recovery remains constrained by a stronger U.S. dollar and elevated Treasury yields. Gold also entered the week after its second consecutive weekly decline.
GOLD Elliott Wave Analysis
GOLD Chart: The Elliott Wave structure remains bearish. Wave 2 appears to have ended near the September high, completing wave c of the preceding correction. From that peak, gold started a new impulsive decline.
The first leg lower developed through waves i–ii, while wave (i) of the next degree terminated at 4,110.84. The subsequent wave (ii) unfolded as an a-b-c corrective structure, with wave c reaching 4,226.71. Price has since turned lower, supporting the view that wave (iii) is beginning.
The 4,110–4,100 region is the first important support and potential reaction zone. A decisive break below it would strengthen the bearish count and expose the 4,050 region. Conversely, 4,226.71 is the immediate structural resistance; sustained strength above the wave (ii) high would weaken the current wave (iii) scenario and require reassessment.
GOLD Forecast: The primary scenario remains bearish while price stays below 4,226.71, with the Elliott Wave structure favoring another impulsive extension lower.
GOLD News: Attention now turns to the FOMC minutes on October 7, which could materially alter expectations for U.S. interest rates and generate volatility in gold
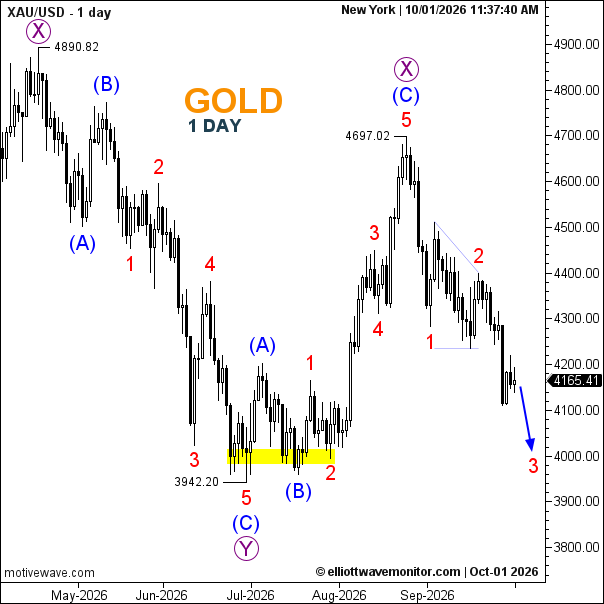 The current Gold Price Forecast remains bearish while the market holds below the Wave 2 high near 4,400. A sustained break beneath 4,100 would provide further confirmation that the downside sequence is extending, exposing the 4,000 area and potentially the previous swing low near 3,942.