Crude Oil Forecast

News & Analysis

Crude Oil Forecast: Wave ii Tests Support Before Further Recovery | November 17, 2026

Key Points
  • USOilSpot has rebounded from its marked support area.
  • Green wave ii is provisionally complete following the earlier wave i advance.
  • A Fibonacci 161.8% extension remains the projected objective for wave iii.
Crude Oil Price

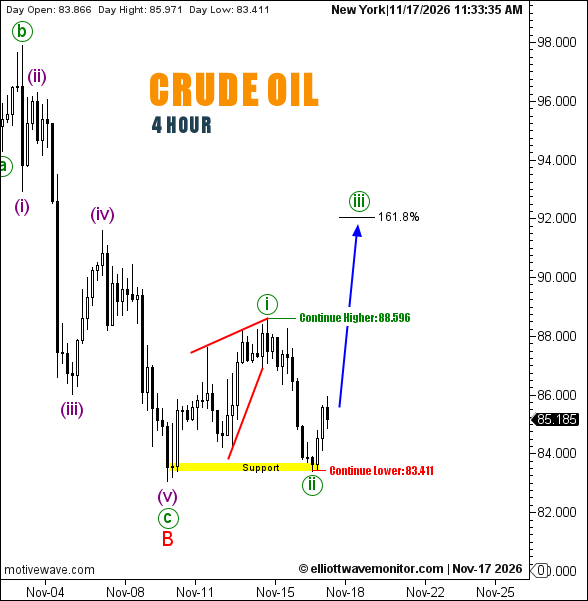
USOilSpot stood at $85.185 at 11:33 a.m. New York time, above its daily opening of $83.866. The four-hour chart recorded a high of $85.971 and a low of $83.411.
Crude Oil Forecast: Wave ii Tests Support Before Further Recovery | November 17, 2026

Crude Oil Elliott Wave Analysis

The recovery anticipated in EWM's November 13 crude oil assessment has developed a clearer internal structure, rather than progressing uninterrupted.

The latest count identifies green wave i following the provisional red B low, with the subsequent decline forming wave ii near the yellow support zone.

Although prices have recovered from that area, the anticipated third-wave advance remains unconfirmed.

The blue projection points toward the 161.8% Fibonacci extension near $92. The updated upside-continuation reference stands at $88.596, while a break below $83.411 would weaken the immediate recovery scenario.

Technical Analysis — November 17, 2026
  • Trend: Corrective recovery, H4.
  • Structure: Green ii provisionally complete; iii projected.
  • Support: Yellow zone near $83.411.
  • Upside continuation: $88.596.
  • Target: Fibonacci 161.8%, approximately $92.

Trader's Question: Would a break below $83.411 formally invalidate the bullish wave count?

Not necessarily. The chart designates that level for downside continuation, not formal invalidation. A breach would challenge the immediate recovery interpretation and require reassessment.

Open article page
News & Analysis

Crude Oil Recovery Advances as Silver's Bearish Wave Path Persists - November 13, 2026

Key Points
  • Crude oil exceeded its previous upside-continuation reference of 87.609 during the day, but the new 88.245 threshold remains untested.
  • Silver recorded a lower daily trough at 49.592, extending its bearish development without reaching the 48.589 downside-continuation level.
  • The forecasts remain distinct: further recovery is projected for USOilSpot, while XAGUSD retains a three-stage corrective and bearish sequence.

Crude oil's recovery has made measurable progress within the Elliott Wave structure established on November 12. The USOilSpot four-hour chart recorded a daily high of 88.226, exceeding the 87.609 upside reference discussed in the previous crude oil analysis. Yet at 8:23:07 a.m. New York time on November 13, the displayed price was 87.519, below that earlier threshold, making a sustained breakout unconfirmed.

The wave count retains the provisional termination of red B, alongside green c and purple (v), following the earlier red A peak. With that structure unchanged, the blue forecast arrow projects further recovery. The new 88.245 marker is explicitly designated Continue Higher, while 83.054 remains the downside-continuation condition. Neither level is identified as a formal invalidation, and the chart provides no final numerical upside target.

USOilSpot H4 CHART — NOVEMBER 13, 2026]

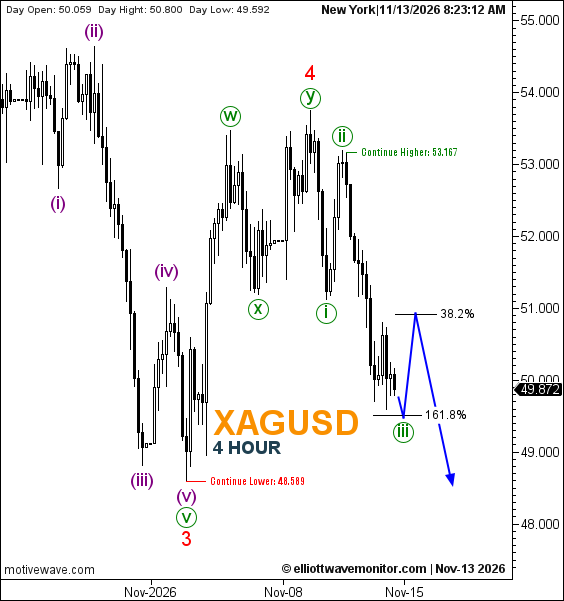
Silver's development is more firmly aligned with the declining structure introduced in the November 12 XAGUSD assessment. Its new four-hour chart shows a daily low of 49.592, below the previous day's 49.700, while the displayed price at 8:23:12 a.m. New York time was 49.872.

The count preserves the completed red wave 4 following green w–x–y, and the subsequent green waves (i) and (ii). From the last observed candles, the connected blue path anticipates three successive stages: a decline to complete green (iii) near the 161.8% Fibonacci extension, a corrective recovery toward 38.2%, and then another downward move. None of these prospective stages is confirmed complete.

[INSERT ORIGINAL XAGUSD H4 CHART — NOVEMBER 13, 2026]

Technical Outlook — H4

Instrument Next projected development Continue Higher Continue Lower
USOilSpot Extension of the recovery following red B 88.245 83.054
XAGUSD Green (iii) decline toward 161.8%, rebound toward 38.2%, then another decline 53.167 48.589

Trader's Question: Has either chart confirmed the next major leg?

Answer: Not fully. Oil has surpassed its previous upside reference intraday but remains below the newly marked 88.245 level. Silver's lower low supports the bearish progression, yet its 48.589 downside-continuation condition and projected Fibonacci sequence remain unresolved.

Open article page

Market guide

About Crude Oil Forecast

Crude Oil is one of the most widely followed commodities in the global financial markets. Oil prices are closely monitored by traders, investors, financial institutions, businesses, and market analysts because of their importance to the global economy and energy markets. Crude Oil is generally priced in US Dollars and is influenced by global supply and demand, economic conditions, geopolitical developments, and energy-market dynamics.

Crude Oil Forecast and Analysis

Our Crude Oil Forecast provides updated market analysis focused on the potential direction of Oil prices. Our analysis covers different timeframes and may include market trends, support and resistance levels, price structure, and potential bullish or bearish scenarios.

At Elliott Wave Monitor, we use Elliott Wave analysis together with technical analysis to study the structure of the Crude Oil market and identify potential price movements. Each analysis is based on the latest available price action and market structure.

What Affects Crude Oil Prices?

Crude Oil prices are influenced by a range of economic, financial, and geopolitical factors, including global supply and demand, economic growth, energy consumption, production levels, and changes in the global economy.

The decisions of OPEC and other major Oil-producing countries can have a significant impact on global Oil supply and prices. Geopolitical tensions, conflicts, sanctions, and unexpected disruptions to Oil production or transportation can also affect market conditions and increase price volatility.

The US Dollar is another important factor because Crude Oil is predominantly priced in US Dollars. Changes in the value of the US Dollar can influence Oil prices and international demand for the commodity.

Oil inventories, refinery demand, interest rates, energy policies, and global economic conditions can also influence Crude Oil prices.

Crude Oil Technical Analysis

Crude Oil Technical Analysis can help traders study important price levels and market structures. Our analysis may include support and resistance levels, trend direction, Elliott Wave counts, potential reversal areas, and different market scenarios.

As market conditions change, technical scenarios can also develop or become invalidated as new price information becomes available. For this reason, our latest Crude Oil analysis is regularly updated on this page.

Latest Crude Oil Forecast

This page brings together the latest Crude Oil Forecast and Crude Oil Analysis from Elliott Wave Monitor. New analysis posts are published regularly, allowing readers to follow Oil price movements across different market conditions and timeframes.

Whether you are looking for a Crude Oil forecast, Oil price analysis, WTI analysis, Brent analysis, Oil technical analysis, or Elliott Wave analysis, this page provides a central place to follow our latest market updates and potential price scenarios.