
USDCAD Forecast

News & Analysis

Forex Outlook: Euro and Aussie Extend Declines as Sterling Eyes a Recovery — November 16, 2026

Key Points

  • AUDUSD and EURUSD: Both four-hour charts retain bearish projections, although corrective rebounds may interrupt further declines.
  • GBPUSD: The latest wave count places the end of its corrective decline at the recent low, with a recovery projected but not confirmed.
  • USDJPY and USDCAD: Their respective bullish structures anticipate corrective pullbacks before potential renewed advances.

The November 16 forex outlook reveals a significant structural development in the Australian dollar, a potentially completed correction in sterling, and continuing downward progression in the euro. The dollar-yen and dollar-Canadian dollar charts remain at different stages of their individual bullish scenarios, with both awaiting further corrective movement.

All five assessments are based on four-hour charts captured between 12:23 and 12:26 p.m. New York time, rather than independently verified live market quotations.

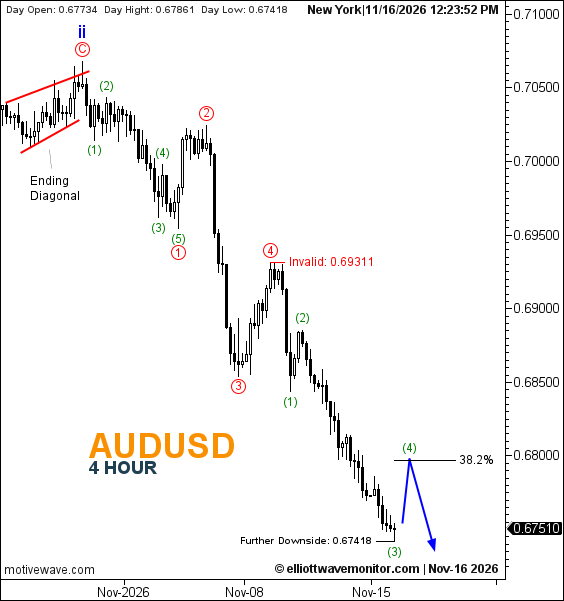
The most pronounced structural progression appears in AUDUSD, where the decline discussed in the November 13 Australian dollar forecast has moved beyond the previously developing red wave 3. The current chart marks red wave 4 at the intervening rebound high, followed by a renewed decline subdivided into green waves (1), (2), and (3).

At 12:23:52 p.m., AUDUSD displayed 0.67510, with a recorded daily low of 0.67418. The projected blue path anticipates a green wave (4) rebound toward the 38.2% Fibonacci retracement, followed by another decline. The chart identifies 0.69311 as invalidation and 0.67418 as Further Downside. The latter is also the recorded daily low, not a separately confirmed future target.
[INSERT ORIGINAL AUDUSD H4 CHART — NOVEMBER 16, 2026]

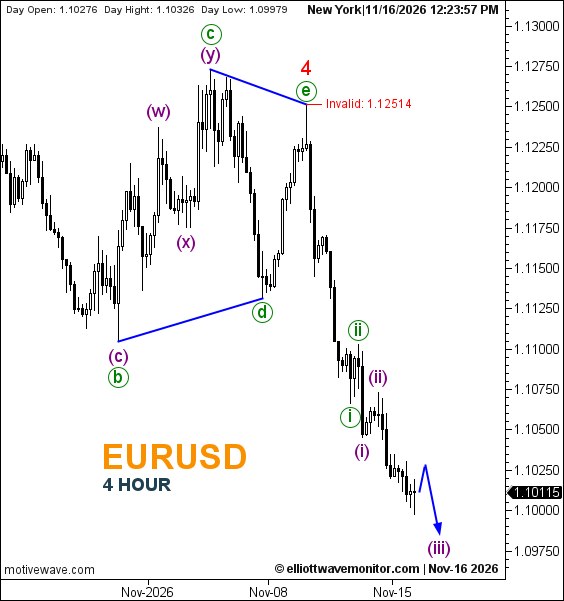
The bearish development in EURUSD has likewise progressed since the November 13 technical assessment, which identified green waves i and ii within the downward structure. The latest chart adds purple subdivisions (i) and (ii), while the anticipated (iii) remains positioned along the future declining path.

The chart displayed 1.10115 at 12:23:57 p.m., after recording a daily low of 1.09979. Its connected blue projection allows a limited upward correction before further downside. The bearish scenario retains 1.12514 as its explicit invalidation level, with no numerical endpoint specified for the projected decline.
[INSERT ORIGINAL EURUSD H4 CHART — NOVEMBER 16, 2026]

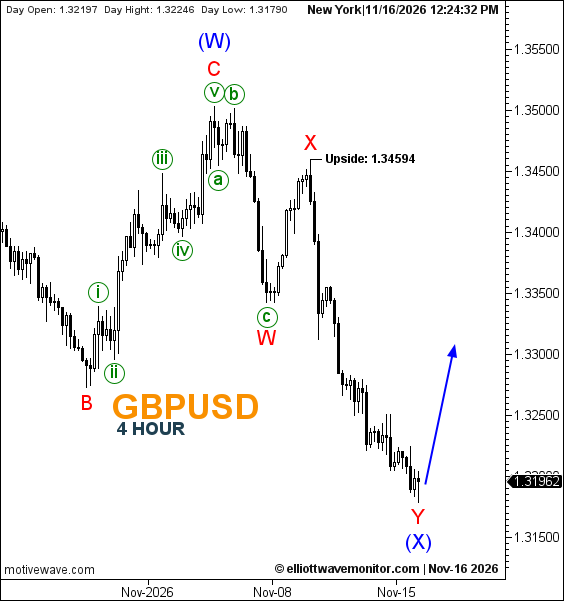
A different technical development is visible in GBPUSD. In the preceding sterling analysis, red wave Y was approaching a deeper Fibonacci retracement within blue wave (X). The new chart now places red wave Y and blue wave (X) at the latest low, suggesting a possible conclusion to the corrective sequence.

Sterling displayed 1.31962 at 12:24:32 p.m., while the day's recorded low stood at 1.31790. The blue arrow projects an upward recovery directly from the recent price structure, but the chart does not yet confirm a sustained reversal. 1.34594, labeled Upside, remains an upper reference rather than a confirmed destination or an invalidation boundary.
[INSERT ORIGINAL GBPUSD H4 CHART — NOVEMBER 16, 2026]

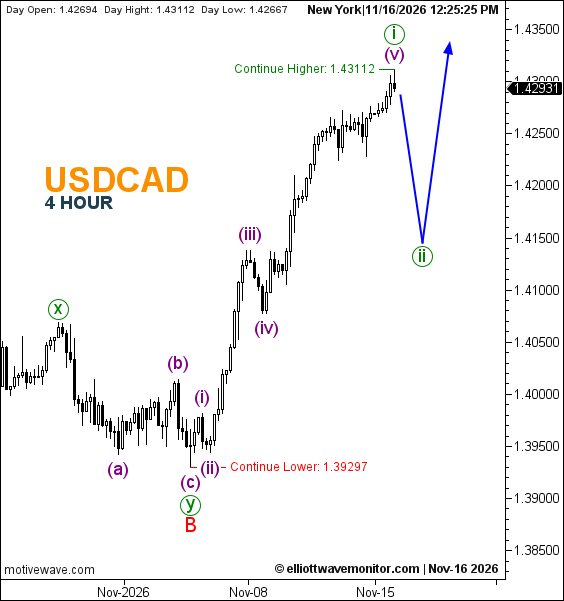
In USDCAD, the advance has extended beyond the upper reference documented in the November 13 combined forex report. The previous 1.42720 Continue Higher level has been surpassed, and the chart now places green wave i at a higher peak, alongside purple wave (v).

The latest snapshot showed 1.42931 at 12:25:25 p.m., following a daily high of 1.43112. That high is also the newly designated Continue Higher reference. The next projected movement remains a green wave ii decline before another potential advance. 1.39297 retains its Continue Lower designation; neither reference is explicitly labeled as invalidation.
[INSERT ORIGINAL USDCAD H4 CHART — NOVEMBER 16, 2026]

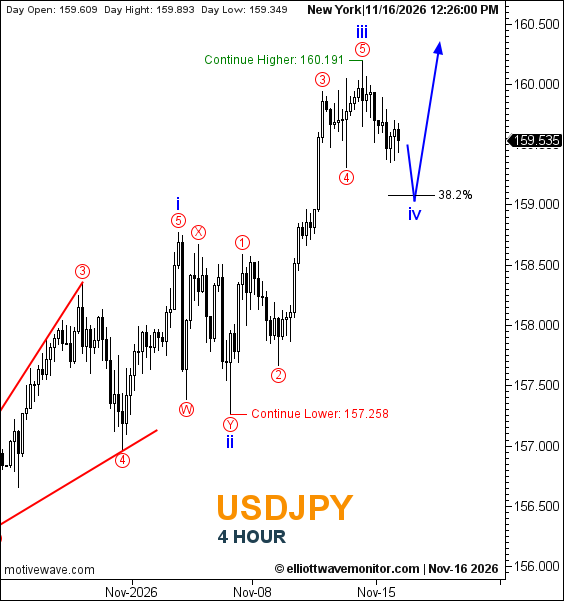
Finally, USDJPY has begun retreating from the previously labeled blue wave iii high. The correction anticipated in the November 13 dollar-yen outlook is developing, although the endpoint of blue wave iv remains prospective.

At 12:26:00 p.m., the chart displayed 159.535, compared with 159.779 in the previous snapshot. The forecast path first declines toward the 38.2% Fibonacci retracement before turning upward. The unchanged continuation references are 160.191 for further upside and 157.258 for further downside. Neither is marked as formal invalidation.
[INSERT ORIGINAL USDJPY H4 CHART — NOVEMBER 16, 2026]

Technical Outlook — November 16, 2026

AUDUSD 0.67510 Wave (4) rebound, then further decline Invalid 0.69311; Further Downside 0.67418
EURUSD 1.10115 Brief recovery, then wave (iii) decline Invalid 1.12514
GBPUSD 1.31962 Potential recovery after wave (X) Upside 1.34594
USDCAD 1.42931 Wave ii correction, then possible advance Higher 1.43112; Lower 1.39297
USDJPY 159.535 Wave iv retracement, then possible advance Higher 160.191; Lower 157.258

Trader's Question: Do the anticipated corrective rebounds and pullbacks indicate confirmed trend reversals?

Answer: No. Each projected correction remains conditional on subsequent price action. A Fibonacci reference or labeled wave endpoint alone cannot establish that the next directional movement has begun.

This report is provided for general market information and education only and does not constitute investment advice.
Open article page
News & Analysis

Forex Elliott Wave Outlook: USDJPY Eyes Wave iv as USDCAD Awaits a Second-Wave Pullback — November 13, 2026

Key Points
  • USDJPY: Blue wave iii is marked at the recent high, with a prospective wave iv retracement toward the 38.2% Fibonacci level before another advance.
  • USDCAD: Green wave i is labeled at the latest high, while the projected sequence calls for a green wave ii correction followed by renewed upside.
  • Both charts retain separate upside- and downside-continuation references, with no explicitly labeled invalidation levels.

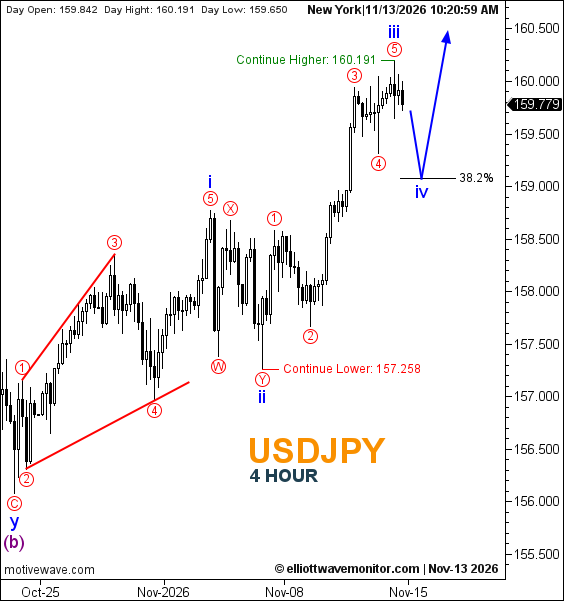
The USDJPY four-hour structure has advanced to a new corrective juncture. The November 13 chart places blue wave iii at the recent high, alongside red wave 5, shifting the next anticipated retreat to blue wave iv. This is a change in corrective wave degree from the red wave 4 pullback discussed in the November 11 forex outlook, rather than evidence that the newly projected correction has already occurred.

At 10:20:59 a.m. New York time, the USDJPY chart displayed 159.779, with a recorded daily high of 160.191 and low of 159.650. The connected blue forecast path first declines toward the 38.2% Fibonacci retracement, where wave iv is positioned, before turning higher. The chart identifies 160.191 as Continue Higher and 157.258 as Continue Lower. Neither is currently labeled as formal invalidation, and no final numerical upside target is supplied.

[INSERT ORIGINAL USDJPY H4 CHART — NOVEMBER 13, 2026]

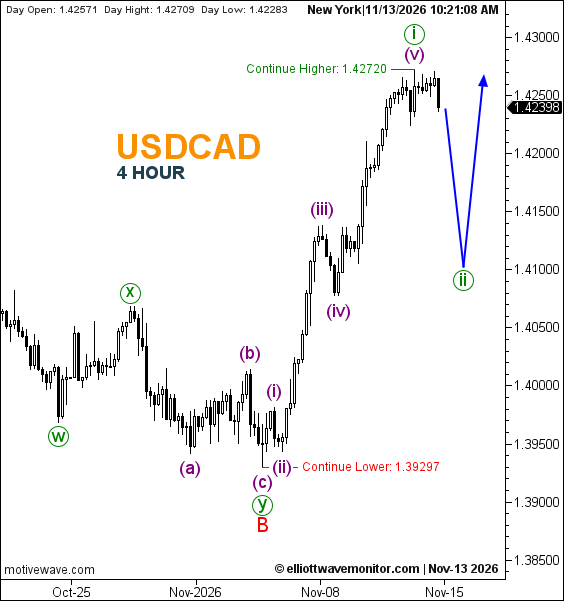
USDCAD presents a different degree of corrective development. The recovery structure described in the preceding November 11 analysis remains intact, with green wave i marked at the latest high after the preceding red B low. Purple subdivisions (iii), (iv), and (v) are visible within the advance. The next anticipated movement is a decline into green wave ii, followed by another potential rise.

The USDCAD chart displayed 1.42398 at 10:21:08 a.m. New York time. Its recorded daily high of 1.42709 remained just below the 1.42720 Continue Higher reference, while the daily low stood at 1.42283. The lower continuation reference is 1.39297, labeled Continue Lower. The projected green wave ii has no precise numerical endpoint or Fibonacci percentage annotated on the chart.

[INSERT ORIGINAL USDCAD H4 CHART — NOVEMBER 13, 2026]

Technical Outlook — Four-Hour Charts

Pair Observed structure Projected sequence Continue Higher Continue Lower
USDJPY Blue iii and red 5 at the recent high Blue iv retracement toward 38.2%, then potential upside 160.191 157.258
USDCAD Green i at the latest high Green ii correction, then potential upside 1.42720 1.39297

Trader's Question: Does the bullish wave structure mean the next movement must be higher?

Answer: No. Both blue forecast paths anticipate an initial corrective decline before any renewed advance. The continuation references are conditional chart annotations, not proof that either future leg has been completed.

Open article page

Market guide

About USDCAD Forecast

USDCAD, also known as the US Dollar to Canadian Dollar currency pair, is one of the major currency pairs in the forex market. It represents the value of the US Dollar against the Canadian Dollar and is closely followed by forex traders, investors, financial institutions, and market analysts worldwide.

USDCAD Forecast and Analysis

Our USDCAD Forecast provides updated market analysis focused on the potential direction of the US Dollar against the Canadian Dollar. Our analysis covers different timeframes and may include market trends, support and resistance levels, price structure, and potential bullish or bearish scenarios.

At Elliott Wave Monitor, we use Elliott Wave analysis together with technical analysis to study the structure of the USDCAD market and identify potential price movements. Each analysis is based on the latest available price action and market structure.

What Affects USDCAD?

The USDCAD exchange rate is influenced by a range of economic and financial factors, including interest rates, monetary policy, inflation, employment, economic growth, commodity prices, and global market conditions.

The monetary policies of the Bank of Canada (BoC) and the US Federal Reserve (Fed) are particularly important. Changes in interest rates and expectations for future monetary policy can influence demand for the Canadian Dollar and US Dollar and, consequently, the USDCAD exchange rate.

Oil prices can also influence the Canadian Dollar because Canada is a major exporter of energy and other natural resources. Economic developments and trade relations between Canada and the United States can also have an impact on USDCAD.

USDCAD Technical Analysis

USDCAD Technical Analysis can help traders study important price levels and market structures. Our analysis may include support and resistance levels, trend direction, Elliott Wave counts, potential reversal areas, and different market scenarios.

As market conditions change, technical scenarios can also develop or become invalidated as new price information becomes available. For this reason, our latest USDCAD analysis is regularly updated on this page.

Latest USDCAD Forecast

This page brings together the latest USDCAD Forecast and USDCAD Analysis from Elliott Wave Monitor. New analysis posts are published regularly, allowing readers to follow the US Dollar against the Canadian Dollar across different market conditions and timeframes.

Whether you are looking for a USDCAD forecast, USDCAD technical analysis, Canadian Dollar analysis, or Elliott Wave analysis, this page provides a central place to follow our latest market updates and potential trading scenarios.