
Bitcoin Price Forecast for October 8, 2026
Bitcoin Rate
BTC/USD is trading near $82,619 on the 4-hour chart, extending its decline from the $87,387 high. The short-term trend remains bearish, with sellers controlling the latest price structure.
Bitcoin Elliott Wave Analysis, Chart and Forecast
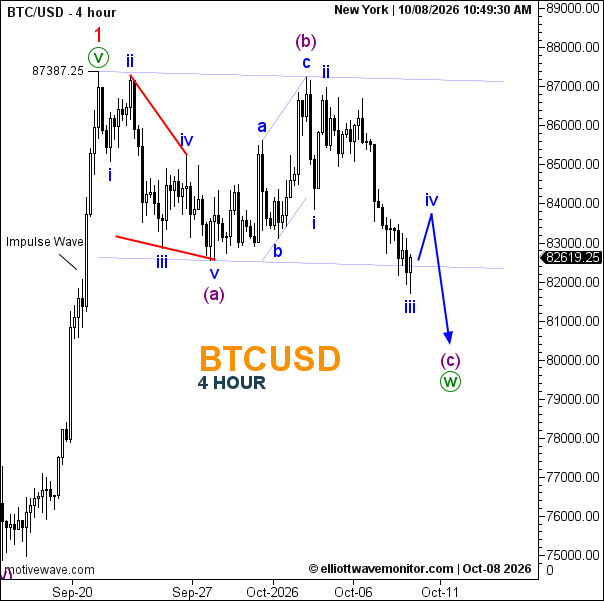
Bitcoin Chart: The rally to $87,387.25 completed a five-wave impulse, labelled wave 1. The subsequent decline is unfolding as an A-B-C zigzag correction, with wave (a) subdividing into five waves and wave (b) forming an a-b-c recovery toward $87,000.
Within wave (c), the decline is developing through an impulsive five-wave sequence. Waves i and ii are complete, wave iii is approaching the $82,000–$82,500 demand zone, and a temporary wave iv recovery toward the $83,500–$84,000 supply zone remains possible.
Bitcoin Forecast: Fibonacci retracement levels around $83,800–$84,100 provide additional resistance confluence. Failure to sustain a recovery would favor wave v of (c) toward $80,000–$79,500, potentially completing the larger wave (w). A sustained recovery above $87,387 would invalidate the immediate bearish corrective count.
Bitcoin News: Rising U.S. Treasury yields and dollar strength are weighing on risk-sensitive assets. The September FOMC minutes reinforced concerns about persistent inflation and further monetary tightening. Upcoming U.S. inflation data and the October 27–28 Fed meeting remain important volatility catalysts.