Nasdaq Forecast

Elliott Wave analysis, market structure and the latest Nasdaq forecasts.

News & Analysis

US Indices Outlook: S&P 500 Pullback Deepens as Nasdaq and Dow Extend Declines — November 16, 2026

Key Points

  • S&P 500: The anticipated second-wave correction has progressed, while 7,300.35 is now explicitly designated as the bullish scenario's invalidation level.
  • Nasdaq 100: The decline following the previously labeled red wave 2 has extended, with further downside still projected.
  • Dow Jones: Selling has continued after the corrective blue wave b recovery, leaving the bearish continuation path intact.

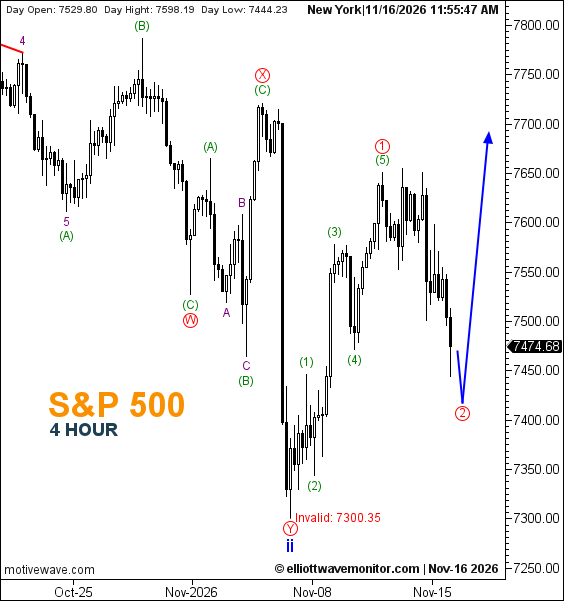
The S&P 500 (SPX500) has moved further into the correction anticipated in the November 13 US indices outlook. Its four-hour chart now displays 7,474.68 at 11:55:47 a.m. New York time on November 16, with a recorded daily low of 7,444.23. The retreat has developed below the earlier chart reading of 7,628.07, although this comparison does not constitute an official daily performance figure.

The wave structure remains unchanged: the preceding five-wave green advance is labeled as red wave 1, while the connected blue projection anticipates further weakness into red wave 2 before a potential recovery. Neither the second-wave low nor the subsequent advance is confirmed. The critical technical revision concerns 7,300.35, which has been reclassified from Continue Lower to an explicit Invalidation level. The recorded daily low remains above that threshold.
SPX

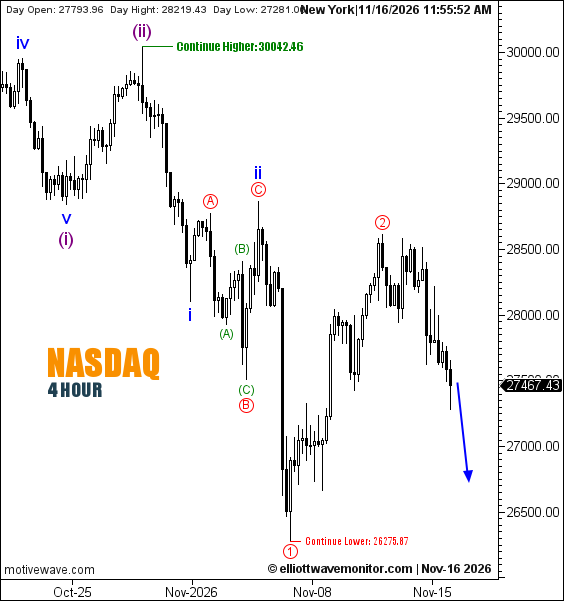
In Nasdaq 100 (NAS100), the downward movement anticipated in the previous Nasdaq assessment has progressed without requiring a revision to the principal wave count. The November 16 chart displays 27,467.43 at 11:55:52 a.m. New York time, compared with 28,385.84 in the preceding snapshot.

Red wave 2 remains labeled at the earlier corrective high, and the observed candles have extended lower. The blue arrow nevertheless represents an additional projected decline, not movement already completed. The chart preserves 30,042.46 as Continue Higher and 26,275.87 as Continue Lower, with neither marked as formal invalidation.
[INSERT ORIGINAL NAS100 H4 CHART — NOVEMBER 16, 2026]

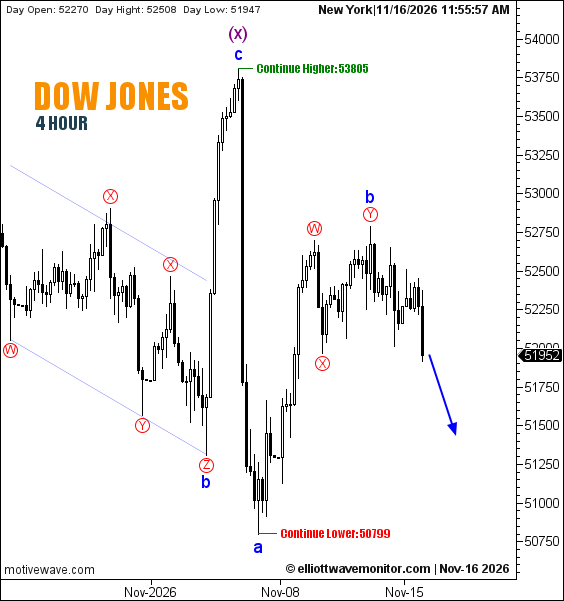
The decline in Dow Jones (US30) has similarly developed beyond the corrective rebound documented in the November 13 Dow Jones analysis. The prior recovery remains labeled blue wave b, alongside red wave Y within the W–X–Y structure.

At 11:55:57 a.m. New York time, the four-hour chart showed 51,952, with a daily low of 51,947. The latest candles document renewed weakness, while the blue arrow anticipates a further decline. The unchanged references are 53,805 — Continue Higher and 50,799 — Continue Lower. The latter is a continuation condition, not a confirmed endpoint of the projected path.
[INSERT ORIGINAL US30 H4 CHART — NOVEMBER 16, 2026]

Technical Outlook — Four-Hour Charts

SPX500 Red wave 2 correction progressing Further pullback, then possible recovery Invalidation: 7,300.35
NAS100 Decline following red wave 2 advancing Additional downside Higher: 30,042.46; Lower: 26,275.87
US30 Decline following blue wave b advancing Additional downside Higher: 53,805; Lower: 50,799

Trader's Question: Has the S&P 500's renewed decline invalidated its projected recovery?

Answer: Not according to the current chart. The scenario remains valid above the explicitly marked 7,300.35 invalidation level. The anticipated recovery is still conditional on completing the projected second-wave correction.
Open article page
News & Analysis

US Indices Elliott Wave Outlook: S&P 500 Faces Wave 2 as Nasdaq and Dow Turn Lower — November 13, 2026

Key Points
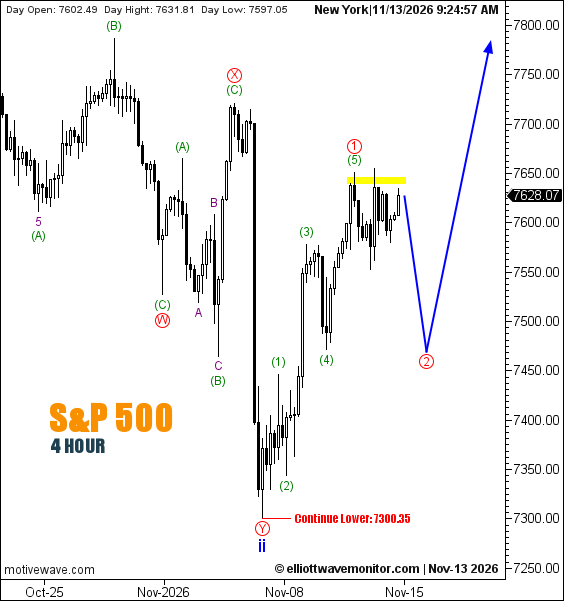
  • S&P 500: A five-wave green advance is now labeled as completed provisionally at red wave 1; the chart projects a red wave 2 pullback followed by another rise.
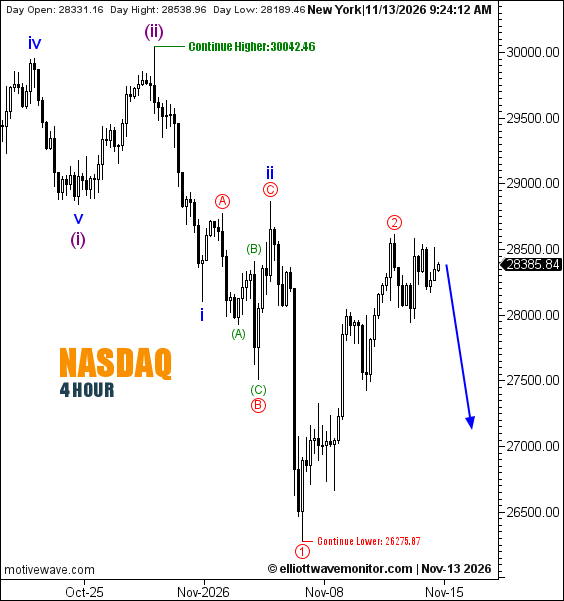
  • Nasdaq 100: Red wave 2 is marked at the recovery high, with the blue arrow projecting renewed weakness rather than another rebound first.
  • Dow Jones: The blue wave b recovery is provisionally labeled at its high, alongside the red W–X–Y correction; the next blue path slopes downward.

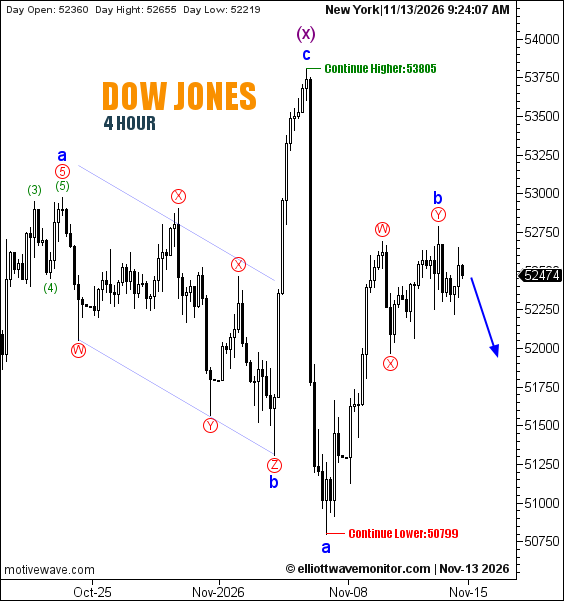
The most significant change in the S&P 500 (SPX500) four-hour structure is the transition from an advancing recovery to a possible second-wave correction. In the November 11 S&P 500 outlook, the analyst projected further upside, an intervening retreat and another advance. The November 13 chart now marks green waves (1)–(5) into a recent peak labeled red wave 1, while the connected blue projection first declines toward a prospective red wave 2 and then turns upward. That second wave and the later advance are still forecasts, not completed movements.

At 9:24:57 a.m. New York time, the SPX500 chart displayed 7,628.07, with a recorded daily high of 7,631.81 and low of 7,597.05. The current horizontal label 7,300.35 reads Continue Lower. It is not marked as invalidation, and the chart supplies neither a numerical endpoint for red wave 2 nor a final upside target.

[INSERT ORIGINAL SPX500 H4 CHART — NOVEMBER 13, 2026]

A different stage is visible in Nasdaq 100 (NAS100). The November 11 Nasdaq assessment still anticipated a corrective rebound toward red wave 2 before a potential decline. The updated chart places red wave 2 at the observed recovery high, following red wave 1 at an earlier trough. At 9:24:12 a.m. New York time, NAS100 displayed 28,385.84, with a daily high of 28,538.96 and low of 28,189.46. Its blue forecast arrow now points lower from the latest candles, without an initial rising stage.

The chart labels 30,042.46 Continue Higher and 26,275.87 Continue Lower. Neither is labeled a formal invalidation; nor does the arrow's endpoint establish 26,275.87 as a completed target.

[INSERT ORIGINAL NAS100 H4 CHART — NOVEMBER 13, 2026]

For Dow Jones (US30), the corrective rebound discussed in the preceding US30 report has developed into a more fully labeled structure. Red W–X–Y subdivisions terminate at a peak also marked blue wave b, after the prior blue wave a low. The November 13 snapshot displayed 52,474 at 9:24:07 a.m. New York time, against a recorded high of 52,655 and low of 52,219. From the last candle, the single blue projected path points downward; no later descending wave is assigned an additional label on the chart.

The active annotations are 53,805 — Continue Higher and 50,799 — Continue Lower, not explicit invalidation levels. A renewed decline remains conditional on subsequent price action.

[INSERT ORIGINAL US30 H4 CHART — NOVEMBER 13, 2026]

Technical Outlook — H4

Index Observed structure Projected sequence Continue Higher Continue Lower
SPX500 Red wave 1 labeled at the green five-wave high Red wave 2 correction, then possible rise Not labeled 7,300.35
NAS100 Red wave 2 marked at the rebound high Further downside 30,042.46 26,275.87
US30 Blue wave b and red Y labeled at the recovery high Further downside 53,805 50,799

Trader's Question: Are the numbers previously described as invalidation levels still invalidation levels?

Answer: Not in these November 13 drawings. The analyst explicitly labels them Continue Higher or Continue Lower. None of the three current charts provides a separately labeled invalidation level, so the former descriptions must not be carried forward automatically.

Open article page

Market guide

About Nasdaq Forecast

The Nasdaq Composite is one of the most widely followed stock market indices in the United States. It tracks thousands of companies listed on the Nasdaq Stock Market and is particularly associated with technology, communication, and growth-oriented companies. The index is closely followed by traders, investors, financial institutions, and market analysts worldwide.

Nasdaq Forecast and Analysis

Our Nasdaq Forecast provides updated market analysis focused on the potential direction of the Nasdaq Composite. Our analysis covers different timeframes and may include market trends, support and resistance levels, price structure, and potential bullish or bearish scenarios.

At Elliott Wave Monitor, we use Elliott Wave analysis together with technical analysis to study the structure of the Nasdaq market and identify potential price movements. Each analysis is based on the latest available price action and market structure.

What Affects Nasdaq Prices?

The Nasdaq is influenced by a wide range of economic, financial, and corporate factors. These include interest rates, monetary policy, inflation, economic growth, corporate earnings, technology-sector performance, investor sentiment, and overall conditions in the US and global economies.

The monetary policy of the US Federal Reserve (Fed) can have a significant impact on the Nasdaq. Changes in interest rates and expectations for future monetary policy can affect borrowing costs, company valuations, liquidity, and investor demand for growth-oriented stocks.

Technology and growth companies have a significant influence on the Nasdaq. Developments in areas such as artificial intelligence, semiconductors, cloud computing, software, and digital services can affect market sentiment and the performance of companies represented in the index.

Corporate earnings, economic data, bond yields, the US Dollar, global market conditions, and changes in investor risk sentiment can also contribute to movements in the Nasdaq.

Nasdaq Technical Analysis

Nasdaq Technical Analysis can help traders study important price levels and market structures. Our analysis may include support and resistance levels, trend direction, Elliott Wave counts, potential reversal areas, and different market scenarios.

As market conditions change, technical scenarios can also develop or become invalidated as new price information becomes available. For this reason, our latest Nasdaq analysis is regularly updated on this page.

Latest Nasdaq Forecast

This page brings together the latest Nasdaq Forecast and Nasdaq Analysis from Elliott Wave Monitor. New analysis posts are published regularly, allowing readers to follow the Nasdaq across different market conditions and timeframes.

Whether you are looking for a Nasdaq forecast, Nasdaq technical analysis, Nasdaq Composite analysis, US stock market analysis, or Elliott Wave analysis, this page provides a central place to follow our latest market updates and potential price scenarios.