
Dow Jones Forecast

Elliott Wave analysis, market structure and the latest Dow Jones forecasts.

Dow Jones Forecast

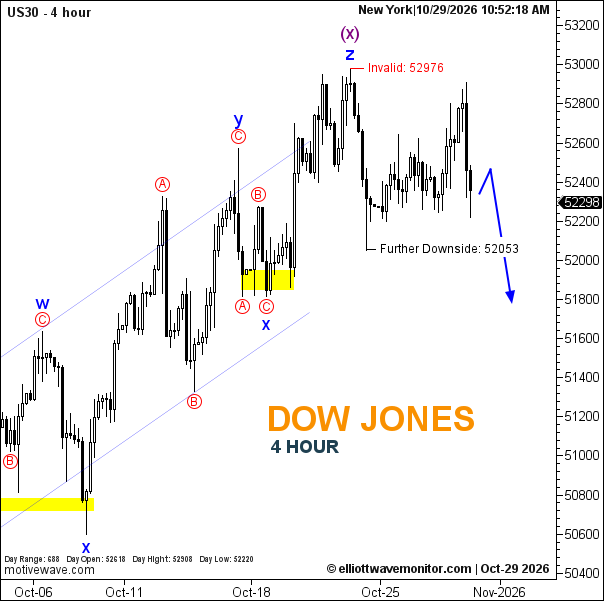
US30 Forecast for October 29, 2026

Price action: US30 is at 52,293, down 0.62% from the day open of 52,618. The displayed high is 52,908 and the low is 52,220, giving a current intraday range of 688 points. The high came within 68 points of the marked invalidation level at 52,976, but did not reach it. These are intraday figures and may change before the session closes.
US30 Forecast for October 29, 2026

Elliott Wave analysis: The October 28 report described a corrective rebound beneath resistance and projected renewed selling toward 52,053. Since its reported price of 52,510, US30 has pulled back to 52,293. Today’s chart retains the blue W-X-Y-X-Z structure, with blue Z and purple (x) marked at the recent peak. The blue projection allows a short rebound before further downside toward the labeled 52,053 area. That target has not yet been reached, so the projected decline remains incomplete. The marked 52,976 invalidation level is unchanged.

Technical Summary

  • Trend: Bearish corrective outlook
  • Current Elliott Wave: Blue W-X-Y-X-Z structure; blue Z and purple (x) marked at the peak
  • Key Support Levels: 52,053; highlighted area near 51,800–52,000
  • Key Resistance / Invalidation: 52,976
  • Next Price Target: 52,053

Q: Has US30 reached the projected downside target?
A: No. It is at 52,293, still above the labeled 52,053 target.
Open article page
Dow Jones Forecast

US30 Elliott Wave Analysis | October 28, 2026

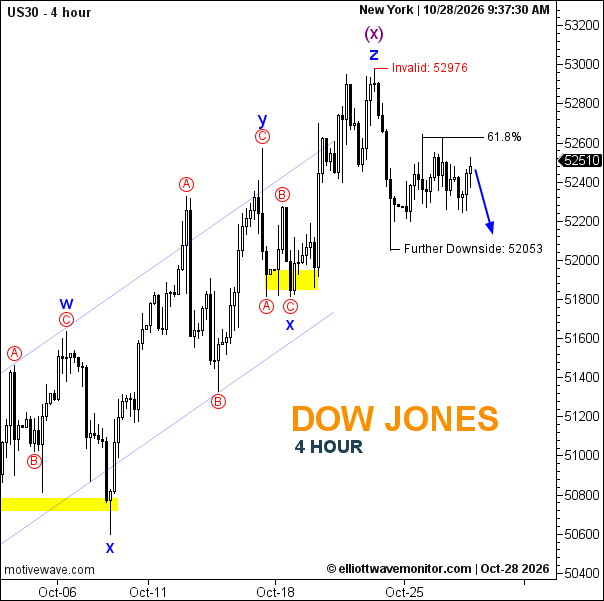
The Dow Jones (US30) has extended its corrective rebound from the previous session, advancing from 52,405 to 52,510 on the 4-hour chart. Unlike the October 27 forecast, which anticipated a recovery toward the 50.0% Fibonacci retracement near 52,550, the updated chart places resistance at the 61.8% retracement near 52,600. The broader bearish scenario remains unchanged following the labeled blue Z and purple (x) high. Price is consolidating beneath Fibonacci resistance, while the newly drawn downward arrow favors renewed selling toward 52,053. A rejection from the current resistance area would support this outlook, whereas a move above 52,976 would invalidate the displayed bearish scenario.

US30 Elliott Wave Analysis | October 28, 2026

Technical Summary of Dow Jones Price for October 28, 2026

  • Trend: Bearish, corrective.
  • Current Elliott Wave: Blue Z and purple (x) labeled; subsequent bearish correction remains active.
  • Key Support Levels: 52,053; approximately 51,800.
  • Key Resistance Levels: Approximately 52,600; 52,976.
  • Next Price Target: 52,053.
  • Invalidation Level: 52,976.
  • Fibonacci Levels: 61.8% retracement near 52,600.
Open article page

Market guide

About Dow Jones Forecast

The Dow Jones Industrial Average (DJIA), commonly known as the Dow Jones or simply the Dow, is one of the most widely followed stock market indices in the United States. It tracks the performance of 30 major US companies across a range of industries and is closely monitored by traders, investors, financial institutions, and market analysts worldwide.

Dow Jones Forecast and Analysis

Our Dow Jones Forecast provides updated market analysis focused on the potential direction of the Dow Jones Industrial Average. Our analysis covers different timeframes and may include market trends, support and resistance levels, price structure, and potential bullish or bearish scenarios.

At Elliott Wave Monitor, we use Elliott Wave analysis together with technical analysis to study the structure of the Dow Jones market and identify potential price movements. Each analysis is based on the latest available price action and market structure.

What Affects Dow Jones Prices?

The Dow Jones is influenced by a wide range of economic, financial, and corporate factors. These include interest rates, monetary policy, inflation, employment, economic growth, corporate earnings, investor sentiment, and overall conditions in the US and global economies.

The monetary policy of the US Federal Reserve (Fed) can have a significant impact on the Dow Jones. Changes in interest rates and expectations for future monetary policy can influence borrowing costs, economic activity, corporate earnings expectations, and investor demand for stocks.

Corporate earnings and financial results from companies included in the index are also important factors. Changes in business conditions, consumer demand, industrial activity, and expectations for future economic growth can affect the performance of the Dow Jones.

Global market conditions, geopolitical developments, the US Dollar, bond yields, and changes in investor risk sentiment can also contribute to movements in the index.

Dow Jones Technical Analysis

Dow Jones Technical Analysis can help traders study important price levels and market structures. Our analysis may include support and resistance levels, trend direction, Elliott Wave counts, potential reversal areas, and different market scenarios.

As market conditions change, technical scenarios can also develop or become invalidated as new price information becomes available. For this reason, our latest Dow Jones analysis is regularly updated on this page.

Latest Dow Jones Forecast

This page brings together the latest Dow Jones Forecast and Dow Jones Analysis from Elliott Wave Monitor. New analysis posts are published regularly, allowing readers to follow the Dow Jones across different market conditions and timeframes.

Whether you are looking for a Dow Jones forecast, Dow Jones technical analysis, DJIA analysis, US stock market analysis, or Elliott Wave analysis, this page provides a central place to follow our latest market updates and potential price scenarios.