
Ethereum Price Forecast for October 8, 2026
Ethereum Rate
ETH/USD is trading near $2,448 on the 4-hour chart, following a sharp decline from the $2,775.60 corrective high. The 4-hour trend remains bearish, with selling pressure accelerating as Ethereum approaches the $2,400 region.
Ethereum Elliott Wave Analysis, Chart and Forecast
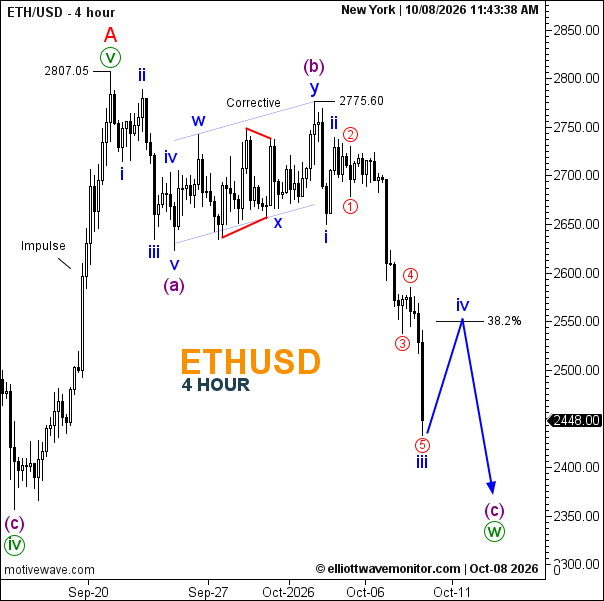 Ethereum Chart: The rally to $2,807.05 completed a five-wave impulse, labelled wave A. The subsequent correction began with a five-wave decline in wave (a), followed by a complex W-X-Y recovery in wave (b), terminating at $2,775.60.
Ethereum Elliott Wave: Wave (c) is now developing as a bearish impulse. Its internal waves i and ii are complete, while wave iii has extended sharply lower through subdivisions ①–⑤. The current structure suggests wave iii is approaching completion near $2,448.
Ethereum Forecast: A corrective wave iv rebound toward $2,550, corresponding to the chart's indicated 38.2% Fibonacci retracement area, could follow. This region represents potential resistance and supply. Once wave iv is complete, wave v could resume the decline toward $2,350–$2,300, potentially completing the larger wave (w).
The $2,400–$2,450 region is an immediate potential demand zone. A sustained recovery above $2,775.60 would invalidate the current immediate bearish count.
Ethereum News: Upcoming U.S. inflation releases and Federal Reserve communications could influence cryptocurrency volatility through changes in interest-rate expectations and risk appetite.