
EUR/USD’s four-hour chart shows 1.12253 after recovering from 1.11129. The count marks wave v complete, with its final (i)–(v) sequence forming an ending diagonal. Price has moved above the diagonal’s upper boundary, supporting a recovery scenario. The projected path allows a pullback toward approximately 1.1200 before an advance toward 1.1340. These moves remain prospective; breaking 1.11129 would invalidate the proposed low.
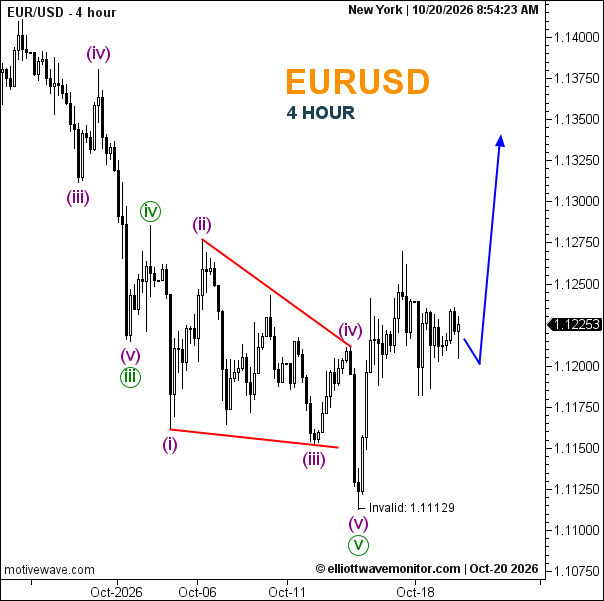
- Trend: Bullish recovery following a completed bearish sequence.
- Trading Range: Approximately 1.1180–1.1270.
- Wave Structure: Ending diagonal potentially completes v; recovery underway.
- Support: Around 1.1200, then 1.11129.
- Resistance: Approximately 1.1270, followed by the projected 1.1340 area.
Will EUR/USD go up?
The chart favours further recovery while 1.11129 holds. Exceeding approximately 1.1270 would strengthen the upside scenario; losing 1.11129 would invalidate it.