
Key Points
- Gold exceeded its previous recovery peak, reaching $4,146.97.
- The updated Elliott Wave count shows further development within blue wave c.
- An additional advance could precede a corrective decline.
Gold Price: XAUUSD traded at $4,138.01 at 6:25 a.m. New York time. The hourly chart records a session high of $4,146.97 and low of $4,057.67, against an opening price of $4,061.56.
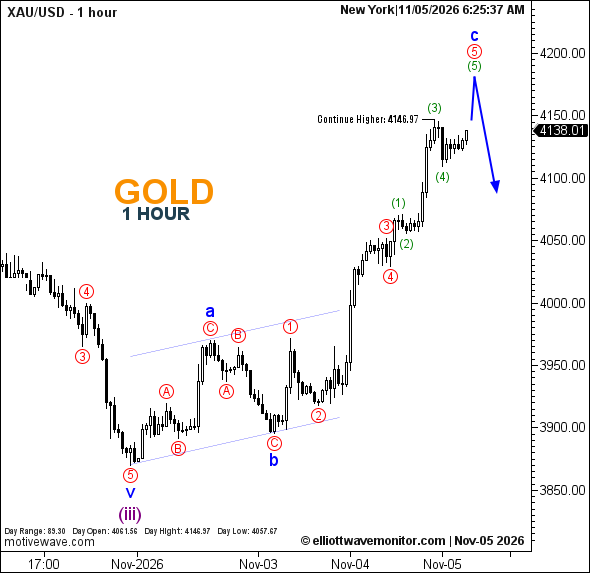
XAUUSD Elliott Wave Analysis
Gold's recovery has accelerated beyond the structure outlined in the November 5 London session outlook, where red wave 4 remained projected.
The updated count now labels that correction within historical price action, followed by a stronger advance featuring green subdivisions (1) through (4).
The blue forecast path anticipates green wave (5) completing alongside red wave 5 and blue wave c, before a potential downward reversal.
Although the bullish sequence has advanced, its projected completion and subsequent decline remain unconfirmed.
Technical Analysis for November 5, 2026
- Structure: Blue wave c developing.
- Next Wave: Green (5), projected.
- Upside Continuation Marker: $4,146.97.
Trader's Question: Does the projected decline mean gold has already reversed?
No. The downward arrow represents a future scenario following a possible wave completion, not an observed bearish reversal.