
Key Points
- Gold extended its decline to $4,010.86, challenging the earlier corrective-completion scenario.
- The revised count places purple wave (a) at the latest low.
- A rebound toward Fibonacci 50% may precede another decline.
Gold Price: XAUUSD traded at $4,016.85 at 9:45 a.m. New York time. The hourly chart records a daily high of $4,067.03 and low of $4,010.86, against an opening price of $4,032.47.
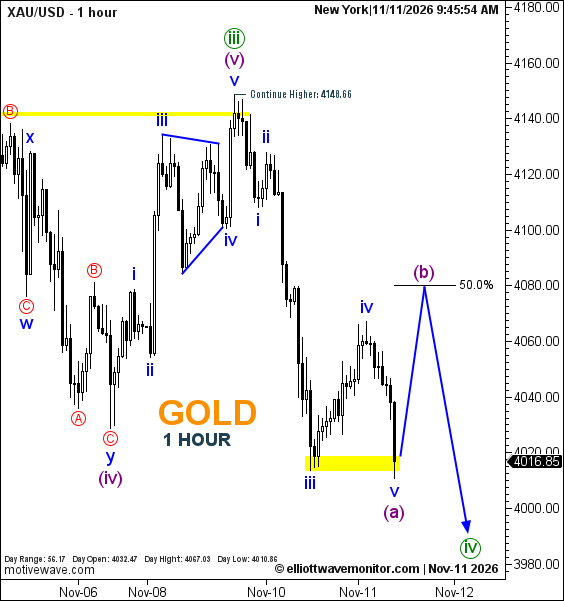
XAUUSD Elliott Wave Analysis
Gold's renewed decline has challenged the provisional wave (iv) completion described in the November 11 London session forecast.
The updated count instead identifies a five-wave blue decline completing purple wave (a) at the latest trough, within a developing correction toward green wave (iv).
The blue projection anticipates purple wave (b) recovering toward the 50% Fibonacci retracement, followed by wave (c) extending lower.
The newly marked yellow support zone is being tested, but the projected recovery and subsequent decline remain unconfirmed.
Technical Analysis for November 11, 2026
- Structure: Purple (a) provisionally complete.
- Next Waves: Purple (b) upward, then (c) downward.
- Fibonacci: 50% retracement.
- Support: Lower yellow-marked zone.
- Upside Continuation Reference: $4,148.66.
Trader's Question: Does the yellow support zone confirm the correction has ended?
No. It identifies a monitored price area, while the revised count still anticipates another downward leg before green wave (iv) potentially concludes.