
Gold’s four-hour chart shows 4,146.93, down from 4,175.81 in the October 16 report. The rebound remained below 4,217.46, preserving the proposed completion of (ii). Its a–b–c structure suggests a running flat, with bearish (iii) still anticipated toward approximately 4,000. A break below 4,066.48 would strengthen continuation; exceeding 4,217.46 would challenge the labelled end of (ii).
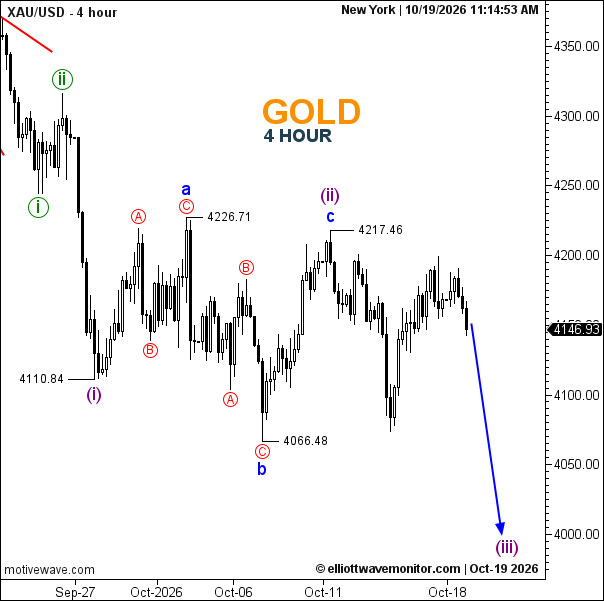
- Trend: Bearish, with renewed downside pressure.
- Trading Range: Broad boundaries at 4,066.48–4,217.46.
- Wave Structure: Proposed running flat completes (ii); (iii) remains unconfirmed.
- Support: 4,110.84, then 4,066.48.
- Resistance: 4,217.46, followed by 4,226.71.
Is gold going up or down?
The count favours downside while 4,217.46 caps rebounds. Breaking 4,066.48 would reinforce that outlook; reclaiming resistance would require reassessment.