
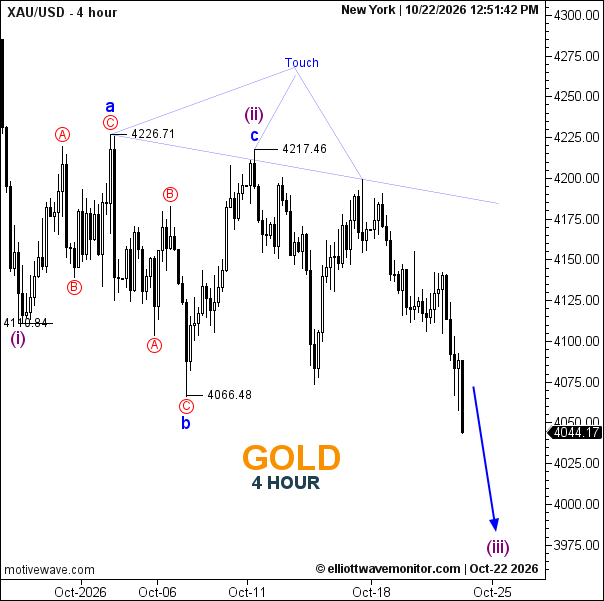
Gold (XAU/USD) maintains a bearish outlook on the 4-hour chart, declining to 4,044.17 as selling pressure accelerates beneath the descending resistance line. The Elliott Wave count identifies the corrective waves a, b, and c, with wave c ending at 4,217.46 and completing the labeled wave (ii). The subsequent decline suggests wave (iii) is developing, supported by successive lower highs and a breakdown beneath the previous 4,066.48 swing low. The blue projection indicates potential continuation toward the 3,980 region, with 4,000 representing an intermediate psychological level. A recovery above 4,066.48 would ease immediate selling pressure, while a sustained move above 4,217.46 would challenge the bearish wave interpretation.
-
Trend: Bearish
-
Key Support: 4,000; 3,980 (projected)
-
Key Resistance: 4,066.48; 4,217.46
-
Projected downside zone 3,980–4,000.
Trader's Question: Has gold entered wave (iii) of its bearish Elliott Wave sequence?
The decline beneath 4,066.48 supports the developing wave (iii) scenario, although its eventual completion level remains unconfirmed.