
Gold is at 4,131.57, down from 4,146.93 on October 19. The chart keeps the proposed running-flat wave (ii) count: wave c peaked at 4,217.46, below wave a at 4,226.71. A downward wave (iii) is projected toward 4,000. The decline remains a scenario; a move above 4,226.71 would challenge this wave-(ii) interpretation.
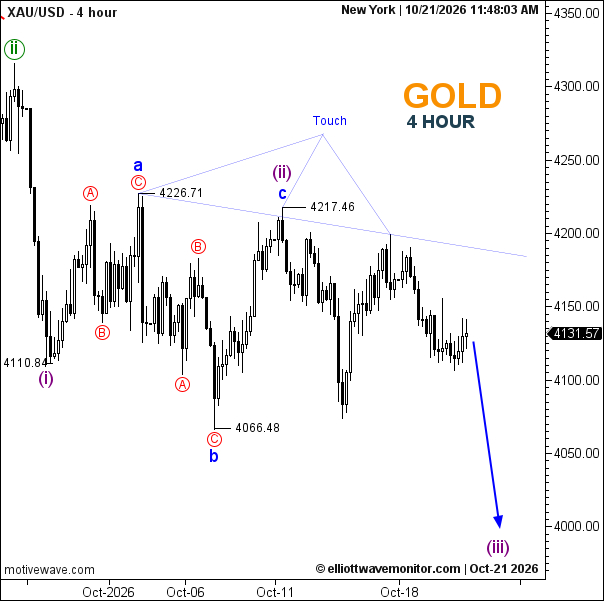
- Trend: Bearish while below 4,217.46.
- Trading Range: 4,066.48–4,217.46.
- Wave Structure: Wave (ii) is marked complete; wave (iii) is projected lower.
- Support: 4,110.84, then 4,066.48.
- Resistance: 4,217.46 and 4,226.71.
Is gold going up or down? The chart favors further downside toward 4,000 while resistance holds; a break above 4,226.71 would challenge that outlook.
XAUUSD News: Gold hovered near $4,130 an ounce after touching its lowest level since October 15. Higher oil prices are reviving inflation concerns and the prospect that interest rates may stay elevated, raising the opportunity cost of holding non-yielding gold. The near-term bias therefore remains cautious to bearish while yields and rate expectations firm.