
Key Points
- Gold's corrective pullback continues without invalidating the anticipated wave (iv) recovery.
- Blue wave b could extend toward the 61.8% Fibonacci retracement.
- The updated chart identifies $3,905.93 as an upside-continuation reference.
Gold Price
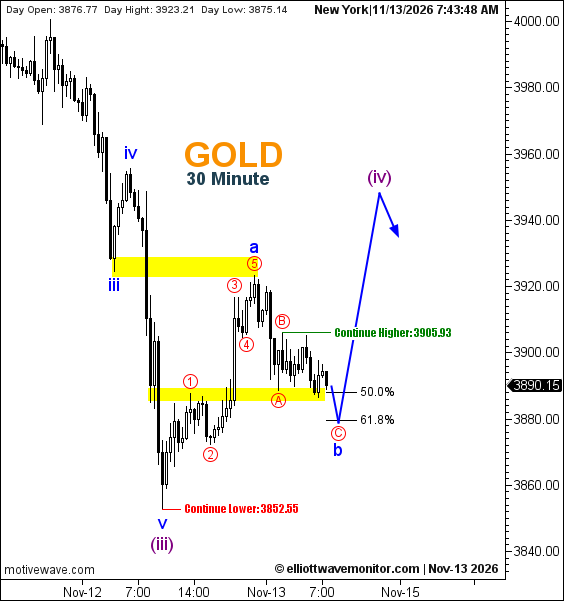
XAUUSD traded at $3,890.15 at 7:43 a.m. New York time. The 30-minute chart records a daily high of $3,923.21 and low of $3,875.14, against an opening price of $3,876.77.
XAUUSD Elliott Wave Analysis
Gold's short-term correction remains consistent with the structure outlined in the earlier November 13 Elliott Wave assessment.
Following blue wave a, the latest count identifies red waves A and B within the developing wave b correction. Red wave C remains projected toward the 61.8% Fibonacci retracement.
A subsequent rebound could carry prices through $3,905.93 and toward the anticipated purple wave (iv) completion near $3,950.
However, neither the corrective low nor the upward extension is confirmed.
Technical Analysis for November 13, 2026
- Structure: Blue b correction developing.
- Fibonacci: 50%–61.8% retracement area.
- Upside Continuation: $3,905.93.
- Downside Continuation: $3,852.55.
- Projected Wave: Purple (iv) recovery.
Trader's Question: Does a rebound above $3,905.93 signal a sustained bullish reversal?
Not necessarily. It would strengthen the corrective recovery scenario, but the larger Elliott Wave structure continues to allow renewed selling after wave (iv).