
Key Points
- Gold established a higher intraday peak at $4,146.76 before retreating.
- The yellow resistance zone remains an obstacle to further gains.
- A final fifth-wave advance could precede a bearish reversal.
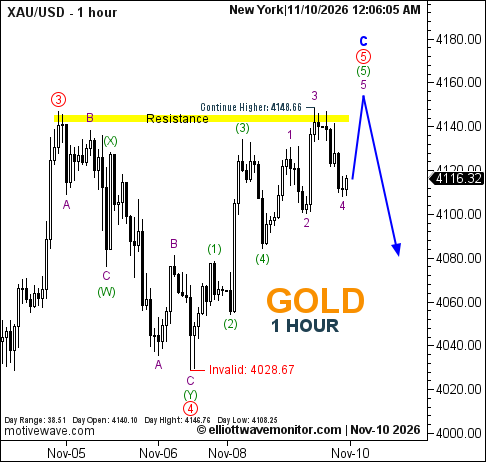
Gold Price: XAUUSD traded at $4,116.32 at 12:06 a.m. New York time. The hourly chart records a daily high of $4,146.76 and low of $4,108.25, against an opening price of $4,140.10.
XAUUSD Elliott Wave Analysis
Gold extended its recovery beyond the previous session's peak, advancing the bullish structure outlined in the November 9 London session forecast.
The updated count identifies purple waves 1 through 4 within the developing fifth-wave sequence. However, the latest high has encountered the chart's designated resistance zone without reaching the $4,148.66 continuation marker.
The blue projection anticipates one additional rise to complete purple wave 5, green wave (5), red wave 5 and blue wave c, followed by a potential downward reversal.
This completion remains provisional rather than confirmed.
Technical Analysis for November 10, 2026
- Structure: Purple wave 4 provisionally complete.
- Resistance: Yellow-marked zone near the recent highs.
- Upside Continuation: $4,148.66.
- Invalidation: $4,028.67.
Trader's Question: Does the projected downward arrow confirm a bearish reversal?
No. It represents the anticipated movement after wave c concludes. The reversal requires independent confirmation from subsequent price action.