
Silver (XAGUSD) is trading at $50.229 as of 11:06 a.m. New York time, down 2.79% from the day's opening price of $51.673. The metal has recorded an intraday high of $51.954 and a low of $49.700, producing a trading range of $2.254. The decline has also carried silver below the previous session's recorded low of $51.375.
XAGUSD Elliott Wave Analysis – H4
The latest decline marks a significant change in silver's Elliott Wave outlook. The November 11 analysis treated the developing weakness as blue wave ii within a potential bullish recovery, but the updated chart introduces a different structure. Red wave 3 is now positioned at the earlier low alongside green (v) and purple (v), while the subsequent green w–x–y recovery is labeled as red wave 4. Following that corrective peak, green wave (i) developed downward and wave (ii) completed its rebound near the newly marked upside-continuation reference at $53.167. The projected path now favors an extension lower in green wave (iii) toward the 161.8% Fibonacci level, followed by a temporary recovery toward the 38.2% retracement before another bearish extension. The $48.589 level, previously identified as bullish-count invalidation, is now explicitly marked as a downside-continuation threshold. Neither the completion of wave (iii) nor the subsequent rebound has been confirmed.
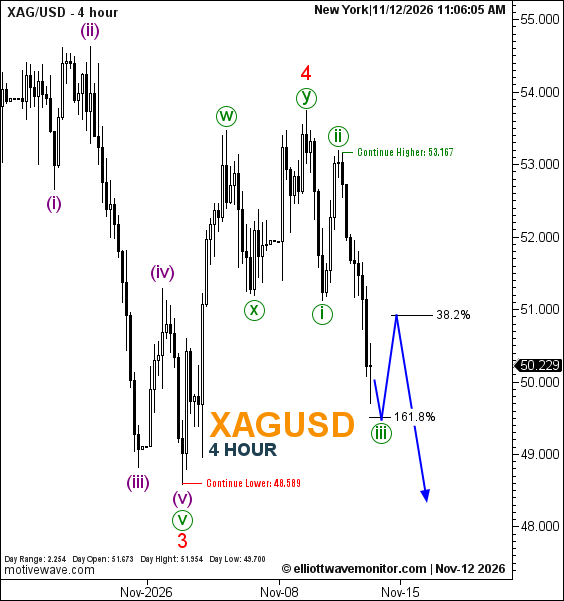
Technical Summary – November 12, 2026
|
Indicator |
Technical outlook |
|---|---|
|
Trend |
Bearish |
|
Current Elliott Wave |
Green (i) and (ii) labeled; green (iii) projected downward |
|
Higher-Degree Structure |
Red wave 3 followed by red wave 4, subdivided into green w–x–y |
|
Key Support |
$49.700 intraday low |
|
Downside Continuation |
$48.589 |
|
Upside Continuation |
$53.167 |
|
Next Price Target |
161.8% Fibonacci extension, followed by a projected rebound toward 38.2% |
|
Fibonacci Levels |
161.8% extension; 38.2% retracement |
|
Invalidation Level |
Not explicitly specified on the updated chart |
Trader's Question: Has silver confirmed a bearish continuation below $48.589?
Not yet. The recorded intraday low remains $49.700. A break below $48.589 would meet the chart's downside-continuation condition, while the projected intermediate rebound has yet to develop.