
Key Points
- Silver's recovery has advanced toward a critical upside continuation marker.
- Red wave 3 is labeled near the latest peak, suggesting a fourth-wave correction may follow.
- The updated chart establishes $48.589 as the scenario's invalidation level.
Silver Price: XAGUSD traded at $52.202 at 2:59 p.m. New York time. The four-hour chart records a daily high of $52.462 and low of $48.954, against an opening price of $49.795.
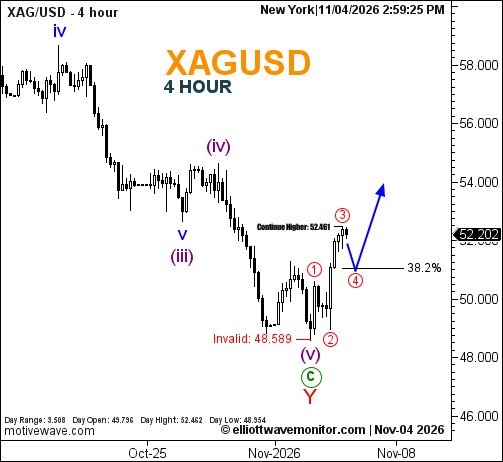
XAGUSD Elliott Wave Analysis
Silver's recovery has gained momentum since the November 3 Elliott Wave assessment, which identified a potential conclusion to the preceding bearish sequence.
The updated count maintains purple wave (v), green wave C and red wave Y at the established structural low. The subsequent advance now places red wave 3 near the latest high.
Although the session briefly exceeded $52.461, a sustained breakout remains unconfirmed. The blue projection anticipates a wave 4 pullback toward the 38.2% Fibonacci retracement before another upward extension.
Technical Analysis for November 4, 2026
- Wave Structure: Red 3 provisionally complete; red 4 projected.
- Fibonacci: 38.2% retracement.
- Upside Continuation: $52.461.
- Invalidation: $48.589.
Trader's Question: Does exceeding $52.461 confirm continued upside?
Not independently. The intraday high crossed that threshold marginally, but confirmation requires subsequent price action supporting a sustained advance.