
Key Points
- Silver's updated Elliott Wave count places red wave 5 at the latest recovery peak.
- Blue wave i appears provisionally complete, shifting attention toward a corrective decline.
- A 50% Fibonacci retracement could precede renewed upside.
Silver Price: XAGUSD traded at $52.230 at 8:06 a.m. New York time. The four-hour chart records a daily high of $53.732 and low of $52.192, against an opening price of $53.414.
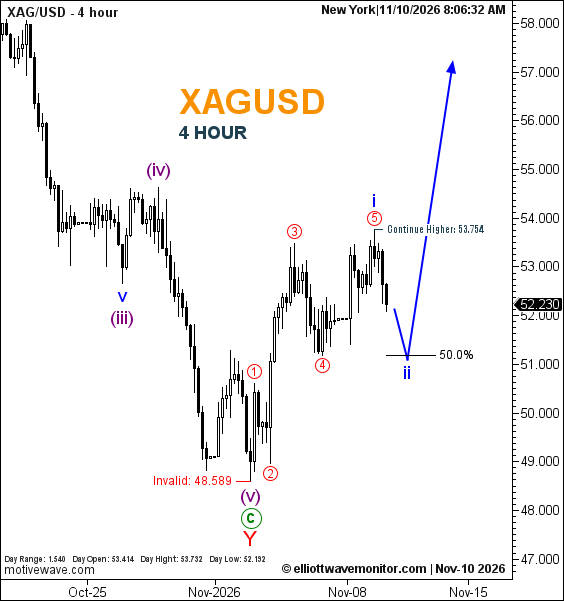
XAGUSD Elliott Wave Analysis
Silver's wave structure has advanced beyond the stage outlined in the November 9 Elliott Wave assessment, when red wave 5 remained projected.
The updated count now labels that advance at the latest peak, provisionally completing blue wave i.
Following this development, the blue projection anticipates a wave ii correction toward the 50% Fibonacci retracement before another upward extension.
Although the session reached $53.732, it remained below the updated $53.754 continuation reference. The projected corrective completion and subsequent recovery remain unconfirmed.
Technical Analysis for November 10, 2026
- Wave Structure: Blue i provisionally complete.
- Next Wave: Blue ii, projected downward.
- Fibonacci: 50% retracement.
- Upside Continuation: $53.754.
- Invalidation: $48.589.
Trader's Question: Does completion of red wave 5 signal the end of silver's broader recovery?
Not necessarily. The revised count places that wave within blue i, allowing another advance after the anticipated second-wave correction.