
Silver (XAG/USD) remains bearish on the hourly chart, trading near 53.975 after extending its decline to 53.426. The Elliott Wave count identifies wave iv completed at the labeled Y and (C) peak, followed by a developing wave v within the larger wave (iii). The decline through the red-labeled waves 1, 2, and 3 confirms persistent selling pressure, while the projected wave 4 suggests a temporary rebound toward approximately 55.20, aligned with the displayed 38.2% retracement. The blue path subsequently anticipates wave 5 extending toward 53.00. The chart marks 58.661 as the broader bearish invalidation level. A recovery above the projected wave 4 area could delay the immediate decline.
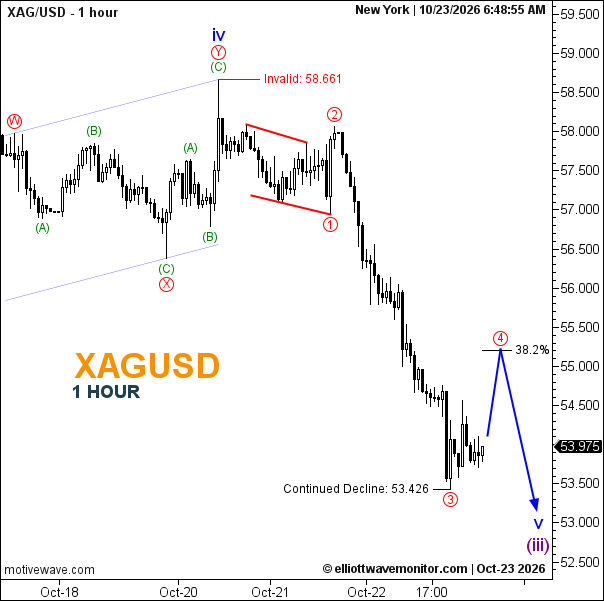
Technical Summary of Silver Price for October 23, 2026
-
Trend: Bearish
-
Key Support: 53.426; 53.00 (projected)
-
Key Resistance: 55.20 (projected); 58.661
-
Trading Range: Projected downside zone 53.00–53.426.
Trader's Question: Will silver rebound before completing wave (iii)?
The projected wave 4 favors a temporary recovery toward 55.20 before another decline toward 53.00, although neither movement is confirmed.