
Key Points
- Gold advanced beyond $4,000, strengthening the projected corrective recovery.
- Red wave 3 is now labeled near the latest price high.
- A 38.2% Fibonacci retracement could precede another upward extension.
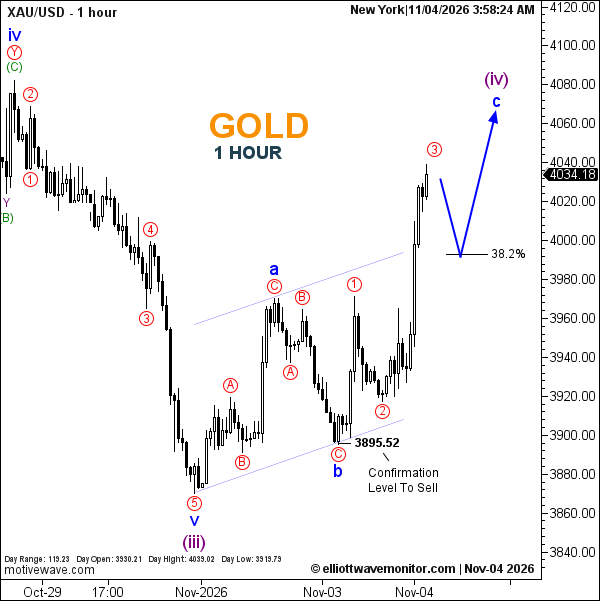
Gold Price: XAUUSD traded at $4,034.18 at 3:58 a.m. New York time. The hourly chart records a daily high of $4,039.02 and low of $3,919.79, against an opening price of $3,930.21.
XAUUSD Elliott Wave Analysis
Gold's advance has reinforced the recovery outlined in the November 3 New York session forecast, when blue wave c was still awaiting a substantial upward extension.
The latest rally has carried prices beyond the previous $3,970.34 upside reference, with red wave 3 now labeled near the advancing structure.
The updated projection anticipates a fourth-wave retracement toward the 38.2% Fibonacci level, followed by renewed appreciation to complete blue wave c within purple wave (iv).
Although the recovery has progressed, neither the projected pullback nor the final upward extension is confirmed.
Technical Analysis for November 4, 2026
- Wave Structure: Blue c developing within purple (iv).
- Fibonacci: 38.2% corrective retracement projected.
- Sell Confirmation Marker: $3,895.52.
Trader's Question: Does trading above $4,000 confirm the corrective recovery is complete?
No. The current count places red wave 3 near the latest high, while the remaining corrective sequence is still projected.