
Key Points
- AUD/USD breached the former bullish invalidation level, overturning the recovery scenario.
- The revised Elliott Wave count places red wave 3 at the latest structural low.
- A 38.2% Fibonacci rebound could precede another bearish extension.
Australian Dollar Rate: AUD/USD traded at 0.69067 at 11:01 a.m. New York time. The four-hour chart records a daily high of 0.69070 and low of 0.68555, against an opening rate of 0.68729.
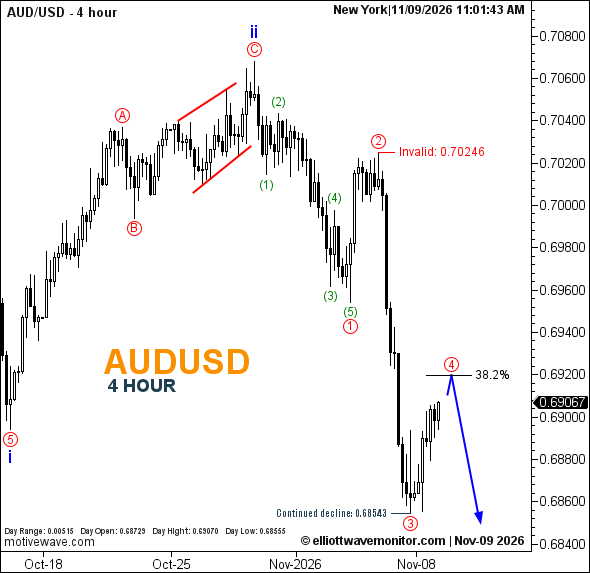
AUDUSD Elliott Wave Analysis
The decline below 0.69543 invalidated the recovery structure maintained in the November 5 Australian dollar forecast, requiring a fundamental revision of the wave count.
The updated structure places blue wave ii at the preceding peak, followed by a five-wave green decline completing red wave 1. Red wave 2 subsequently formed before selling extended into wave 3 near the marked 0.68543 low.
The blue projection now favors a red wave 4 recovery toward Fibonacci 38.2%, followed by another decline through wave 5.
Technical Analysis for November 9, 2026
- Trend: Bearish.
- Wave Structure: Red 3 provisionally complete; red 4 projected.
- Fibonacci: 38.2% retracement.
- Downside Reference: 0.68543.
- Invalidation: 0.70246.
Trader's Question: Would the projected fourth-wave rebound signal a bullish reversal?
Not under the revised count. It represents a potential countertrend correction, while the anticipated fifth-wave decline remains subject to confirmation.