CAD/JPY maintains a bearish broader outlook despite a potential corrective rebound, with the chart showing 111.954. The Elliott Wave count identifies the previous (W)-(X) structure, followed by a five-wave decline labeled green i–v, completing red wave A near the October low. Price has since recovered toward the highlighted resistance area around 112.50, but the recovery remains unconfirmed. The blue projection anticipates red wave B advancing toward the 61.8% Fibonacci retracement near 113.60, followed by wave (Y) and the larger wave 2 declining toward approximately 108.50. A break below 110.167 would strengthen bearish continuation, while 115.588 remains the annotated invalidation level. Compared with the previous structure, the current setup favors a temporary recovery before renewed selling pressure.
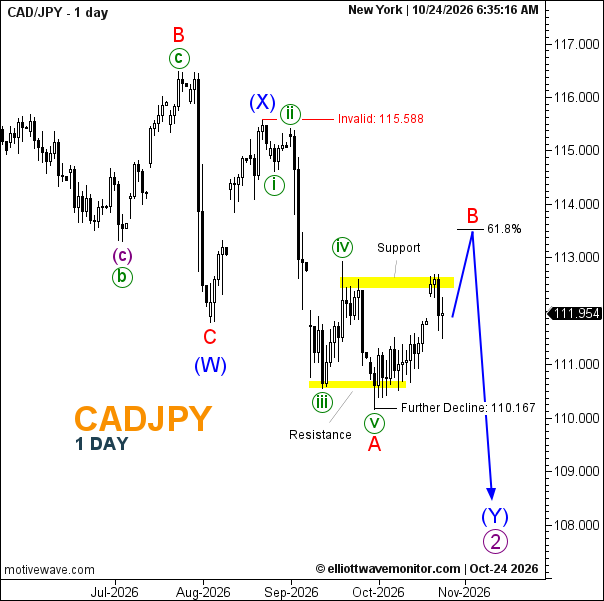
Technical Summary of CAD/JPY Price for October 24, 2026
-
Trend: Bearish — corrective rebound anticipated.
-
Current Elliott Wave: Red wave B projected after completion of wave A; larger (Y)/2 decline anticipated.
-
Key Support Levels: 110.167 (annotated downside threshold); 110.50–110.60 (highlighted historical zone).
-
Key Resistance Levels: 112.50 (approximate highlighted resistance); 113.60 (projected Fibonacci area).
-
Next Price Target: 113.60 (wave B), followed by approximately 108.50 (projected downside).
-
Invalidation Level: 115.588 (annotated).
-
Fibonacci Levels: 61.8% retracement near 113.60, projected wave B reversal area.
Trader's Question: Can CAD/JPY complete wave B before resuming its bearish trend?
A recovery through the 112.50 resistance area would support an advance toward the 61.8% retracement near 113.60, where the projected wave B reversal could precede another decline.