Key Points
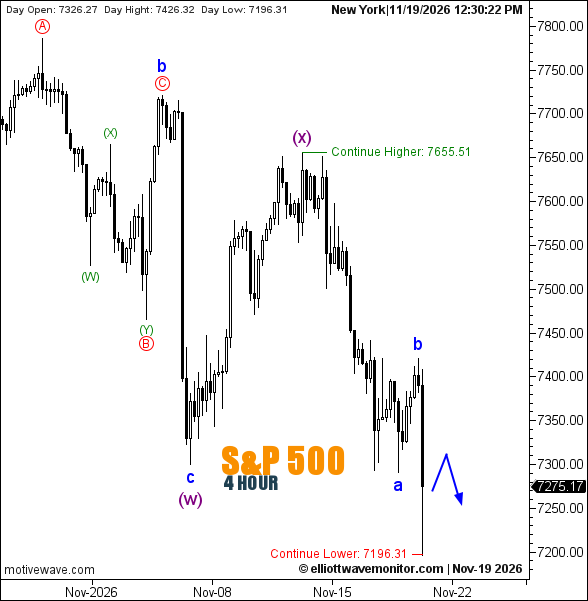
- S&P 500: The former bullish scenario has been invalidated below 7,300.35, with a revised corrective structure now projecting a brief rebound followed by further weakness.
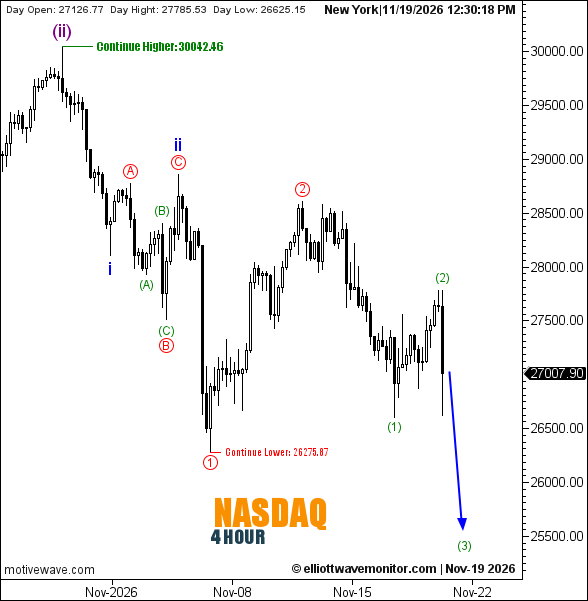
- Nasdaq 100: The decline has progressed into a more developed wave structure, with another downward leg anticipated.
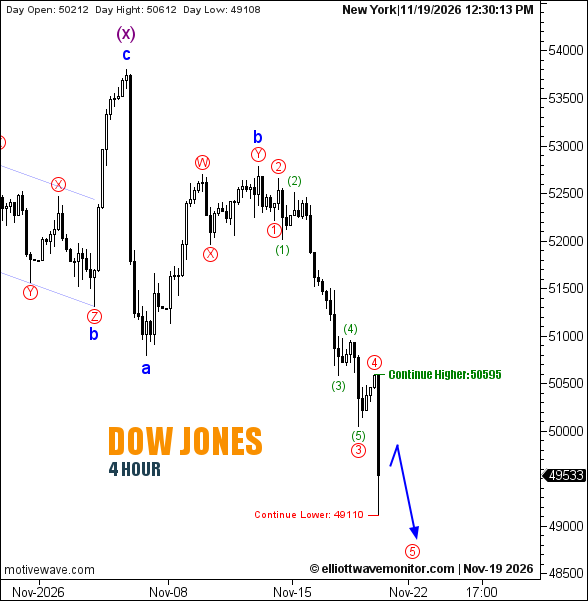
- Dow Jones: The bearish sequence has advanced, while 50,595 replaces 53,805 as the chart's Continue Higher reference.
The S&P 500 (SPX500) has undergone the most consequential technical revision in the November 19 US indices outlook. The bullish structure described in the November 16 assessment is no longer valid after the market moved below its explicitly designated 7,300.35 invalidation threshold.
The new four-hour chart replaces the former red wave 1–2 scenario with a corrective count incorporating blue a–b–c subdivisions and purple (w)–(x) labels. The latest observed sequence places blue wave a at a recent trough and blue wave b at the subsequent rebound high. From the final candles, the connected blue forecast path anticipates a limited recovery before another decline. Neither projected leg has been completed.
At 11:59:51 a.m. New York time, the chart displayed 7,257.43. The separately annotated 7,655.51 corresponds to the earlier purple (x) high, but carries no explicit confirmation or invalidation designation. No replacement invalidation level or numerical downside target is supplied.
The Nasdaq 100 (NAS100) continues to develop along the bearish direction outlined in its November 16 outlook. The previous chart projected additional downside after red wave 2; the updated count now identifies green wave (1) at an intervening low and green wave (2) at the following recovery high.
The November 19 snapshot displayed 26,936.28 at 11:59:59 a.m. New York time. The next blue arrow points downward toward prospective green wave (3), rather than indicating a completed third wave.
The technical references remain unchanged: 30,042.46 — Continue Higher and 26,275.87 — Continue Lower. The projected arrow extends below the lower reference, although no precise endpoint is labeled. Neither continuation level is identified as formal invalidation.
A more advanced downward subdivision is evident in Dow Jones (US30). Following the blue wave b recovery discussed in the November 16 report, the current chart identifies red waves 1 through 4, including green internal waves (1)–(5) within the third-wave decline.
At 12:00:03 p.m. New York time, US30 displayed 49,474. The blue projection allows a short rebound before another descent toward prospective red wave 5, whose numerical endpoint is unspecified.
The chart now marks 50,595 as Continue Higher, replacing the previous 53,805 reference. The printed daily high of 50,612 exceeded that level, but the displayed snapshot price was substantially lower; therefore, the chart alone does not establish sustained upside confirmation. The former 50,799 Continue Lower annotation is absent from the current drawing.
Technical Outlook — Four-Hour Charts
| S&P 500 | Former bullish count invalidated; new corrective structure | Limited rebound, then further decline | 7,300.35: former invalidation breached; 7,655.51: unlabeled-function reference |
| Nasdaq 100 | Green waves (1) and (2) labeled | Decline toward prospective (3) | Higher: 30,042.46; Lower: 26,275.87 |
| Dow Jones | Red waves 1–4 labeled | Brief rebound, then prospective wave 5 decline | Continue Higher: 50,595 |
Trader's Question: Does the S&P 500's invalidation level establish a new downside target for all three indices?
Answer: No. It invalidates only the S&P 500's former bullish count. Each revised or continuing scenario must be evaluated against its own chart annotations and subsequent price action.