
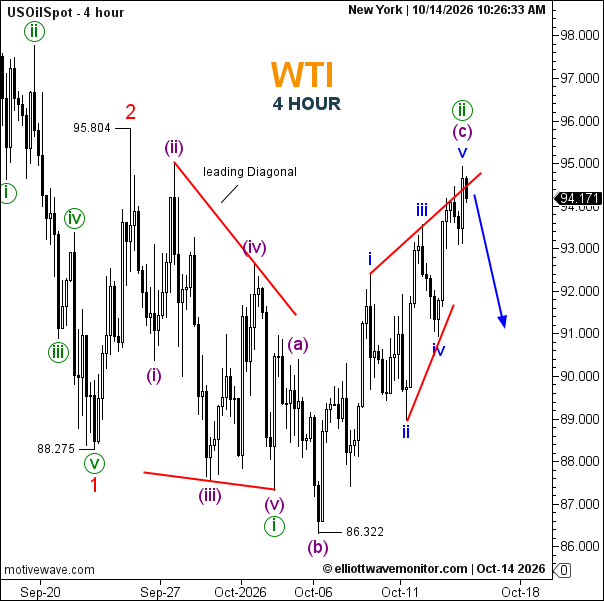
WTI Rate: WTI stood at $94.171 on the four-hour chart at 10:26 AM New York time, approaching resistance near $95.
WTI Crude Oil Outlook
The Elliott Wave count identifies wave 1 at $88.275 and wave 2 at $95.804, followed by a Leading Diagonal in wave (i), ending near $87.
Wave (ii) is developing an A–B–C correction from $86.322. Its final wave (c) contains five subdivisions, with wave v approaching completion near $94.50–$95.
- Wave Structure: Bearish impulse; corrective rebound.
- Trendline: Rising corrective channel.
- Support: $93, then $91.
- Resistance: $95 and $95.804.
Completion of wave (ii) could initiate wave (iii) downward. A sustained move above $95.804 would invalidate the proposed wave (ii) count.
WTI News: Middle East shipping risks supported oil prices, while the IEA lowered its 2026 demand outlook. The next EIA petroleum inventory report is scheduled for October 15.