
Key Points
- Oil breached its previous support zone, challenging the anticipated third-wave advance.
- Purple wave (v) and green wave a are provisionally complete.
- The next projected recovery is now corrective wave b.
Crude Oil Price
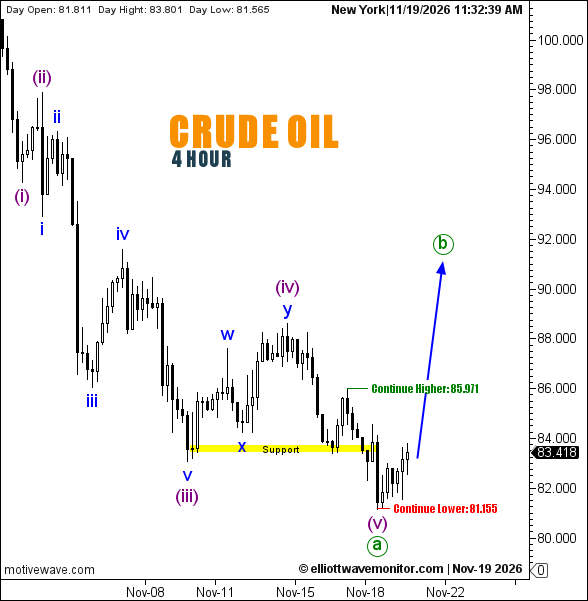
USOilSpot stood at $83.418 at 11:32 a.m. New York time, above its daily opening of $81.811. The four-hour chart recorded a high of $83.801 and a low of $81.565.
Crude Oil Elliott Wave Analysis
The recovery outlined in EWM's November 17 crude oil forecast failed to develop into the anticipated third-wave advance. Instead, prices broke beneath the previously marked support area.
The revised count identifies blue w–x–y subdivisions within purple wave (iv), followed by a decline completing purple wave (v) provisionally alongside green wave a.
This structural change reshapes the outlook. Rather than projecting an impulsive third wave, the blue path now anticipates a corrective green wave b recovery toward the $91–$92 region.
The advance remains unconfirmed, with $85.971 marking upside continuation.
Technical Analysis — November 19, 2026
- Trend: Bearish decline; corrective rebound projected.
- Structure: Green a provisionally complete; b expected.
- Former support: Yellow zone near $83.5, breached.
- Upside continuation: $85.971.
- Downside continuation: $81.155.
Trader's Question: Would crossing $85.971 restore the previous bullish third-wave scenario?
Not automatically. That would strengthen the current recovery, but the revised count identifies it as wave b rather than an impulsive wave iii.