
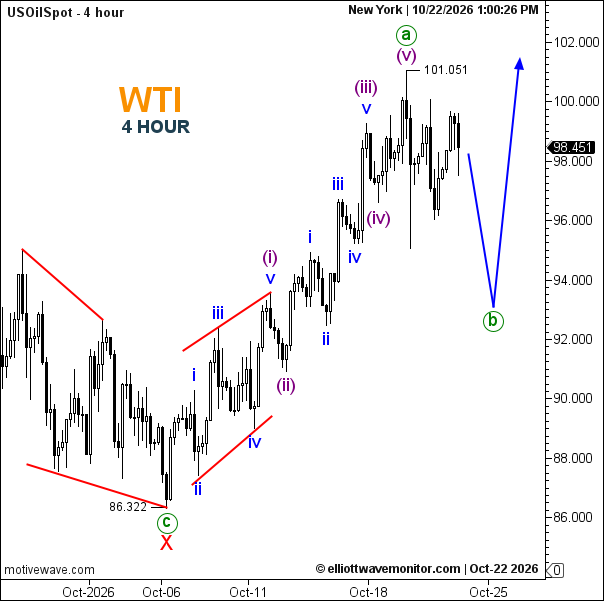
WTI (crude oil) maintains a bullish broader structure on the 4-hour chart, with the displayed price at 98.451 following an advance from 86.322 to 101.051. The Elliott Wave count identifies the rally as wave (v), completing wave a, while the preceding low is labeled wave X. The projected blue path suggests a corrective wave b decline toward approximately 93.00 before a potential renewed advance toward 102.00. Recent consolidation beneath 101.051 indicates weakening upward momentum, although the broader recovery structure remains intact. A break below 96.00 would strengthen the corrective scenario, while sustained movement above 101.051 would challenge the expectation of an immediate pullback.
-
Trend: Bullish
-
Key Support: 96.00 (approximate); 93.00 (projected)
-
Key Resistance: 100.00; 101.051
-
Projected corrective zone 93.00–96.00.
Trader's Question: Will WTI oil correct lower before resuming its advance?
The completed wave a labeling and projected wave b favor a temporary decline toward 93.00, followed by a possible recovery toward 102.00.