
Key Points
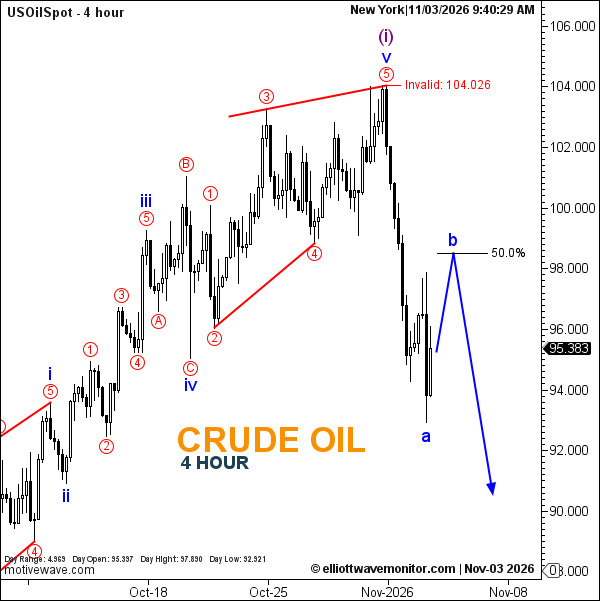
- Crude oil recorded a low of $92.921, extending beyond the initial downside projection.
- Blue wave a is now labeled at the latest trough.
- A corrective rebound toward the 50% Fibonacci retracement could precede further losses.
Crude Oil Price: USOilSpot traded at $95.383 at 9:40 a.m. New York time. The four-hour chart records a daily high of $97.890 and low of $92.921, against an opening price of $95.397.
Crude Oil Elliott Wave Analysis
Oil's decline has extended beyond the initial $97 area anticipated in the November 2 crude oil analysis, bringing a deeper correction into focus.
The updated Elliott Wave count places blue wave a at the latest trough, following the provisional completion of purple wave (i) at the preceding peak.
The projected path now favors a recovery within blue wave b toward the 50% Fibonacci retracement. A renewed downward extension remains the preferred subsequent scenario, although neither projected leg is confirmed.
Technical Analysis for November 3, 2026
- Trend: Bearish correction.
- Wave Structure: Blue a provisionally complete; blue b projected.
- Fibonacci: 50% corrective retracement.
- Invalidation: $104.026.
- Next Move: Temporary recovery followed by potential downside.
Trader's Question: Has the earlier $94 downside objective completed the forecast?
Not entirely. Price reached that area before the projected wave b recovery, so the original sequence has not been fully realized.