
Key Points
- EUR/USD has rebounded following a three-wave corrective decline.
- The updated Elliott Wave count places blue wave (2) at the recent low.
- A temporary Fibonacci pullback could precede another upward extension.
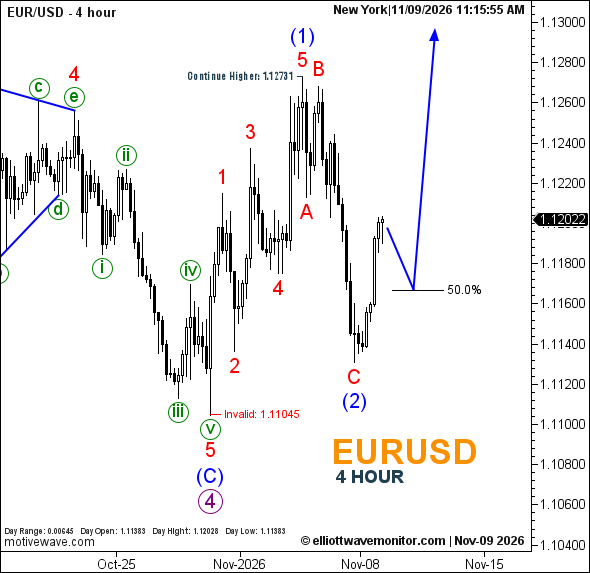
EURUSD Rate: EUR/USD traded at 1.12022 at 11:15 a.m. New York time. The four-hour chart records a daily high of 1.12028 and low of 1.11383, against an opening rate of 1.11383.
EURUSD Elliott Wave Analysis
The corrective decline anticipated in the November 5 EURUSD Elliott Wave analysis has developed through red waves A, B and C, followed by a recovery from the latest trough.
The revised count now identifies blue wave (1) at the preceding 1.12731 peak and blue wave (2) at the corrective low, replacing the earlier i–ii notation.
This development supports a potential conclusion to the correction without confirming a sustained bullish extension.
The projected path anticipates a limited retracement toward Fibonacci 50%, followed by renewed appreciation. The bullish scenario remains conditional, with no precise final upside target established.
Technical Analysis for November 9, 2026
- Structure: Blue wave (2) provisionally complete.
- Fibonacci: 50% retracement projected.
- Upside Continuation: 1.12731.
- Invalidation: 1.11045.
Trader's Question: Is the 50% Fibonacci retracement a confirmed support zone?
No. It represents a potential corrective reference rather than designated support. The subsequent price response will help assess whether the recovery can continue.