Key Points
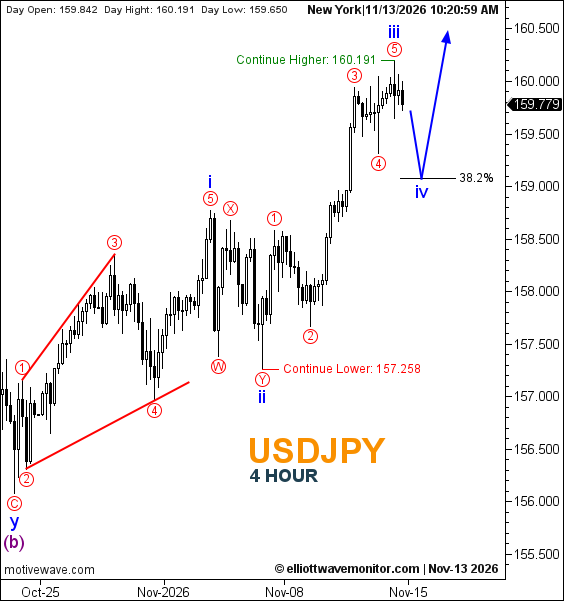
- USDJPY: Blue wave iii is marked at the recent high, with a prospective wave iv retracement toward the 38.2% Fibonacci level before another advance.
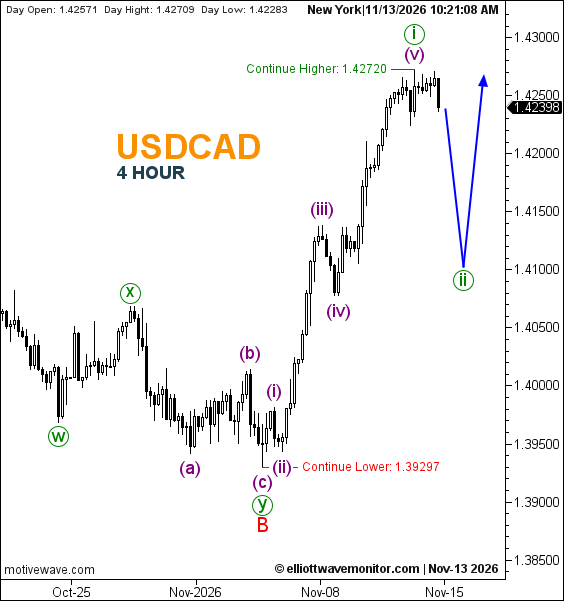
- USDCAD: Green wave i is labeled at the latest high, while the projected sequence calls for a green wave ii correction followed by renewed upside.
- Both charts retain separate upside- and downside-continuation references, with no explicitly labeled invalidation levels.
The USDJPY four-hour structure has advanced to a new corrective juncture. The November 13 chart places blue wave iii at the recent high, alongside red wave 5, shifting the next anticipated retreat to blue wave iv. This is a change in corrective wave degree from the red wave 4 pullback discussed in the November 11 forex outlook, rather than evidence that the newly projected correction has already occurred.
At 10:20:59 a.m. New York time, the USDJPY chart displayed 159.779, with a recorded daily high of 160.191 and low of 159.650. The connected blue forecast path first declines toward the 38.2% Fibonacci retracement, where wave iv is positioned, before turning higher. The chart identifies 160.191 as Continue Higher and 157.258 as Continue Lower. Neither is currently labeled as formal invalidation, and no final numerical upside target is supplied.
USDCAD presents a different degree of corrective development. The recovery structure described in the preceding November 11 analysis remains intact, with green wave i marked at the latest high after the preceding red B low. Purple subdivisions (iii), (iv), and (v) are visible within the advance. The next anticipated movement is a decline into green wave ii, followed by another potential rise.
The USDCAD chart displayed 1.42398 at 10:21:08 a.m. New York time. Its recorded daily high of 1.42709 remained just below the 1.42720 Continue Higher reference, while the daily low stood at 1.42283. The lower continuation reference is 1.39297, labeled Continue Lower. The projected green wave ii has no precise numerical endpoint or Fibonacci percentage annotated on the chart.
Technical Outlook — Four-Hour Charts
| Pair | Observed structure | Projected sequence | Continue Higher | Continue Lower |
|---|---|---|---|---|
| USDJPY | Blue iii and red 5 at the recent high | Blue iv retracement toward 38.2%, then potential upside | 160.191 | 157.258 |
| USDCAD | Green i at the latest high | Green ii correction, then potential upside | 1.42720 | 1.39297 |
Trader's Question: Does the bullish wave structure mean the next movement must be higher?
Answer: No. Both blue forecast paths anticipate an initial corrective decline before any renewed advance. The continuation references are conditional chart annotations, not proof that either future leg has been completed.