GBP/JPY remains bearish on the daily chart, trading near 209.849 after rejection from the resistance zone around 211.50–212.00. The Elliott Wave count identifies the previous wave (B) peak at 219.653, followed by a developing five-wave decline within blue wave (C). Red waves 1–4 are labeled, with wave 4 approaching the annotated 211.989 upside reference before the latest rejection. The blue projection anticipates wave 5 extending toward approximately 206.00 to complete wave (C), followed by a potential recovery toward 215.50. The highlighted support zone near 207.70–208.20 remains important, while renewed strength above 211.989 would weaken the immediate bearish scenario. No previous GBP/JPY daily report is available for comparison.
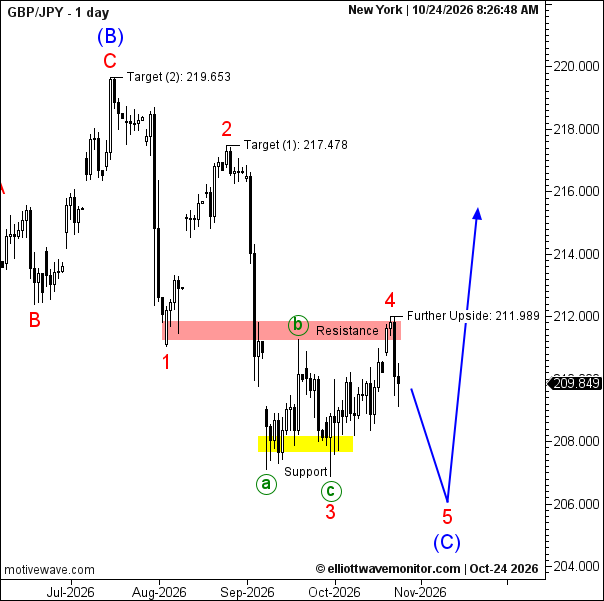
Technical Summary of GBP/JPY Price for October 24, 2026
-
Trend: Bearish; bullish reversal projected after wave 5.
-
Current Elliott Wave: Red wave 5 projected within blue wave (C).
-
Key Support Levels: 207.70–208.20 (approximate highlighted zone); 206.00 (projected).
-
Key Resistance Levels: 211.50–212.00 (highlighted zone); 211.989 (annotated upside reference).
-
Next Price Target: Approximately 206.00, followed by a projected recovery toward 215.50.
Trader's Question: Will GBP/JPY complete wave (C) before reversing upward?
The projected wave 5 decline toward 206.00 supports a potential completion of wave (C), but the subsequent bullish reversal requires confirmation through price action.