
GBPUSD is trading at 1.32188 on the 4-hour chart as of 11:39 a.m. New York time, down approximately 0.13% from the daily opening rate of 1.32358. The pair has recorded an intraday high of 1.32511 and a low of 1.32164, representing a trading range of 34.7 pips. These readings reflect the ongoing trading day.
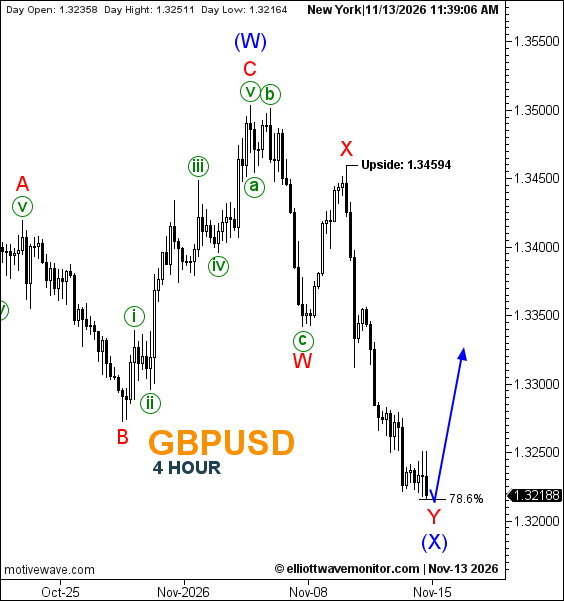
GBPUSD Elliott Wave Analysis – H4
Sterling's corrective decline has extended beyond the 61.8% Fibonacci area discussed in the November 11 forex outlook, bringing the developing red wave Y toward the deeper 78.6% retracement.
The broader structure remains unchanged: blue wave (W) marks the preceding high, while the subsequent red W–X–Y sequence forms the developing blue wave (X).
Red wave W ended alongside green c, and the intervening wave X recovery reached the marked 1.34594 high before sellers resumed control.
The updated projection now places red Y and blue (X) near the current Fibonacci support area, suggesting that the correction could be approaching completion. A sustained upward reaction would support the blue arrow's anticipated recovery toward the 1.3300 region, although the corrective low remains unconfirmed.
The chart identifies 1.34594 as the upside-continuation reference, while no explicit wave-count invalidation level is provided. Reaching Fibonacci 78.6% alone does not establish that wave (X) has ended.
Trader's Question: Does GBPUSD reaching the 78.6% Fibonacci retracement confirm the end of wave (X)?
No. The retracement defines a potential completion zone for red Y and blue (X), but a sustained bullish response is still needed to support the projected recovery.