
Key Points
- Sterling breached the former 1.33424 invalidation threshold, overturning the previous corrective count.
- The updated Elliott Wave structure identifies red waves W and X, with Y still projected.
- A further decline toward Fibonacci 61.8% could precede renewed appreciation.
British Pound Rate: GBP/USD traded at 1.33217 at 11:52 a.m. New York time. The four-hour chart records a daily low of 1.33123 and high of 1.34594, against an opening rate of 1.34417.
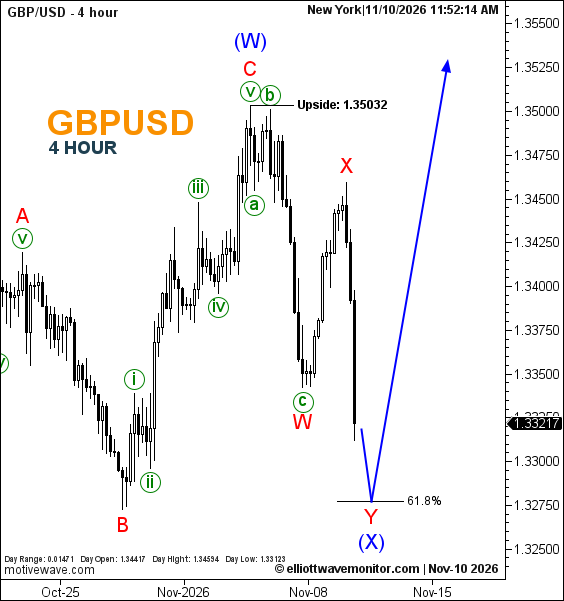
GBPUSD Elliott Wave Analysis
Sterling's decline has breached the invalidation boundary established in the earlier November 10 GBPUSD analysis, requiring a reassessment of the anticipated recovery.
The revised count retains blue wave (W) at the preceding peak but reclassifies the subsequent decline as red wave W, followed by a corrective rebound labeled X.
The projected path now anticipates red wave Y extending toward the 61.8% Fibonacci retracement, potentially completing the larger blue wave (X).
A subsequent upward recovery remains favored, although the corrective low has not been confirmed.
Technical Analysis for November 10, 2026
- Scenario: Previous count invalidated.
- Structure: Red W–X formed; Y projected.
- Fibonacci: 61.8% retracement.
- Upside Reference: 1.35032.
Trader's Question: Would reaching Fibonacci 61.8% confirm the correction has ended?
No. The retracement identifies a potential turning point. Confirmation requires subsequent price action supporting completion of wave (X) and renewed upside.