
GBP/USD’s four-hour chart shows 1.33667 after rallying from 1.31372, where (v) completed the labelled wave iii. The recovery forms a developing wave iv, with (a) marked at 1.33718. Price has marginally exceeded that marker, so (a)’s endpoint remains provisional. The projected path anticipates a (b) pullback toward the marked 50.0% area near 1.3255, followed by renewed upside toward approximately 1.3390.
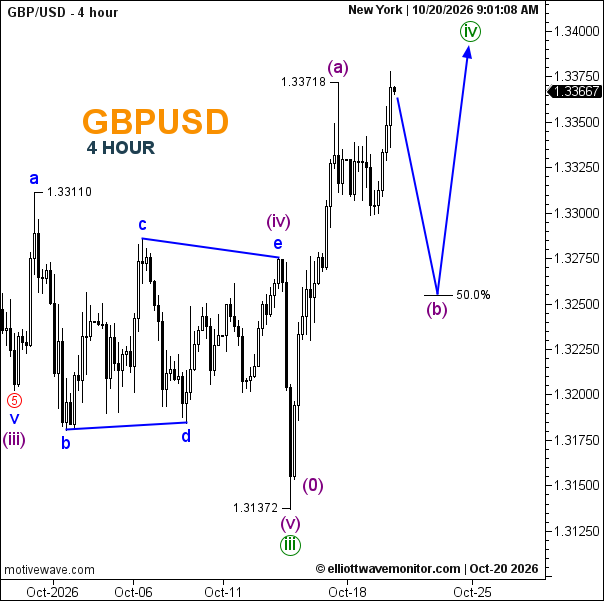
- Trend: Corrective rally within a broader bearish sequence.
- Trading Range: Approximately 1.3300–1.3380.
- Wave Structure: iii labelled complete; iv developing, with (b) still anticipated.
- Support: 1.33110; projected pullback area near 1.3255.
- Resistance: Around 1.3380–1.3390.
Will GBP/USD go up or down?
The chart favours a pullback before another advance. Breaking 1.31372 would invalidate the proposed start of the wave iv recovery.