
GBP/USD maintains a cautiously bullish outlook on the 4-hour chart, trading near 1.33852 following a strong recovery from 1.31372. The Elliott Wave count identifies wave (v) completing the larger wave (iii) at the October low, followed by an advancing (a)-(b)-(c) structure toward the projected wave (iv). Recent higher highs support buying pressure, although consolidation beneath 1.34192 suggests resistance is emerging. The blue projection anticipates a final advance toward approximately 1.34300 before a corrective decline toward 1.33500. A sustained breakout above 1.34192 would strengthen the immediate upside scenario, while rejection near the projected wave (iv) completion could initiate the anticipated pullback.
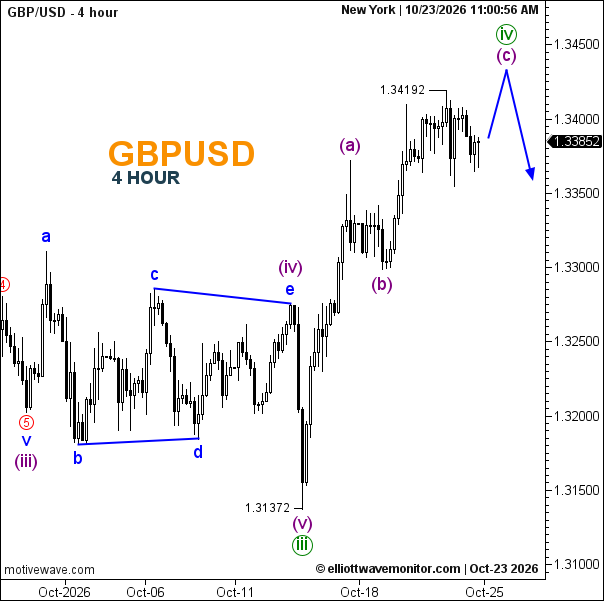
Technical Summary of GBP/USD Price for October 23, 2026
-
Trend: Bullish
-
Daily Support Levels: 1.33500 (projected); 1.33000 (approximate historical reference).
-
Daily Resistance Levels: 1.34192 (annotated); 1.34300 (projected).
-
Elliott Wave Patterns: Wave (iii) completed at 1.31372; corrective (a)-(b)-(c) recovery toward wave (iv), followed by a projected decline.
-
Trading Range: Projected upside zone 1.34192–1.34300.
Trader's Question: Is GBP/USD approaching completion of corrective wave (iv)?
The labeled (a)-(b)-(c) structure suggests wave (iv) may finish near 1.34300, followed by a potential decline toward 1.33500, but confirmation remains pending.