
Key Points
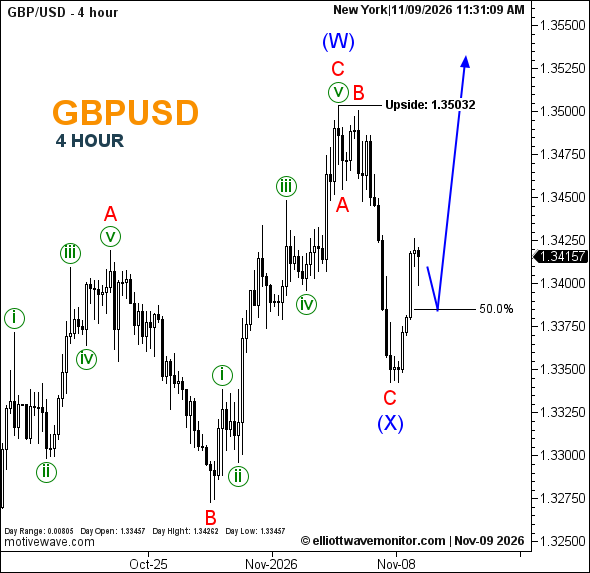
- The Elliott Wave count now identifies blue wave (W) at the previous recovery peak.
- A subsequent A–B–C correction has established a provisional blue wave (X) low.
- A 50% Fibonacci pullback could precede another upward extension.
British Pound Rate: GBP/USD traded at 1.34157 at 11:31 a.m. New York time. The four-hour chart records a daily high of 1.34262 and low of 1.33457, against an opening rate of 1.33457.
GBPUSD Elliott Wave Analysis
Sterling's latest structure represents a significant revision to the November 5 GBPUSD forecast, which anticipated the final upward development of blue wave a.
The updated count instead places blue wave (W) at the 1.35032 peak, followed by a red A–B–C decline completing blue wave (X) provisionally.
The subsequent rebound supports a possible resumption of the recovery. However, the projected path allows another short-term retracement toward Fibonacci 50% before a stronger advance.
No new invalidation threshold or exact final upside objective is specified.
Technical Analysis for November 9, 2026
- Structure: Blue (W) labeled; blue (X) provisionally complete.
- Fibonacci: 50% retracement projected.
- Reference High: 1.35032.
- Next Move: Temporary pullback followed by potential upside.
Trader's Question: Does the revised count invalidate the previous bullish outlook?
Not necessarily. It changes the interpretation of the recovery, while the directional projection remains upward after a potential corrective pullback.