
GBP/USD remains within a broader bearish trend on the 4-hour chart, trading near 1.3240 after a prolonged decline. The Elliott Wave structure shows wave (iii) completing at 1.32043, followed by a corrective wave (iv) that unfolded as a Flat correction. That correction terminated at 1.33110, allowing the larger bearish impulse to resume through wave (v).
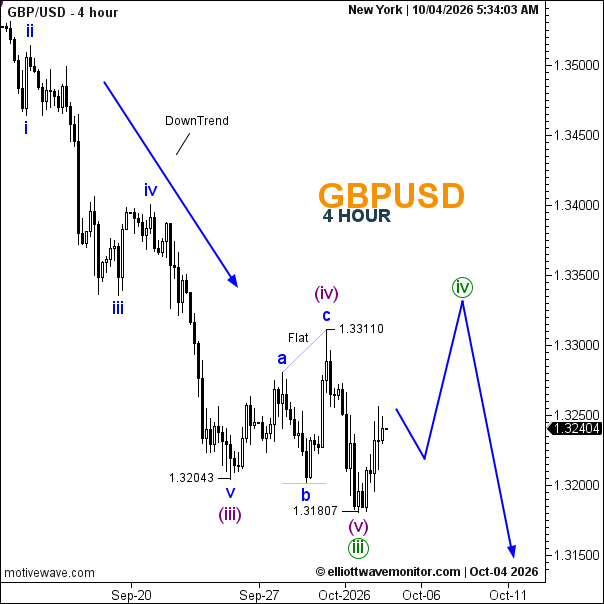
GBP/USD Elliott Wave Analysis: Corrective Wave iv Expected
The Flat in wave (iv) developed through waves a-b-c, with wave b declining to 1.31807 before wave c advanced to 1.33110. The subsequent selloff completed wave (v) and therefore wave iii of the larger-degree bearish sequence.
GBP/USD is now expected to enter wave iv, a higher-degree corrective phase against the prevailing downtrend. The initial rebound may still require another pullback before the correction develops toward the 1.3300–1.3350 region, as projected on the chart.
This distinction between degrees is important: the previous Flat was wave (iv) inside wave iii, whereas the developing correction is wave iv of the larger impulse. Once wave iv is complete, the Elliott Wave count favors another decline in wave v, potentially extending below the recent lows toward the 1.3150 region.
- The broader outlook remains bearish, while the near-term structure favors a corrective recovery before the final wave v decline.