
Key Points
- Gold recorded a fresh intraday high, extending the corrective recovery.
- Red wave 3 is now labeled at the latest peak.
- A 38.2% Fibonacci retracement may precede another upward extension.
Gold Price: XAUUSD traded at $4,031.57 at 10:22 a.m. New York time, after reaching $4,051.78 earlier in the session. The hourly chart shows a daily low of $3,919.79 and an opening price of $3,930.21.
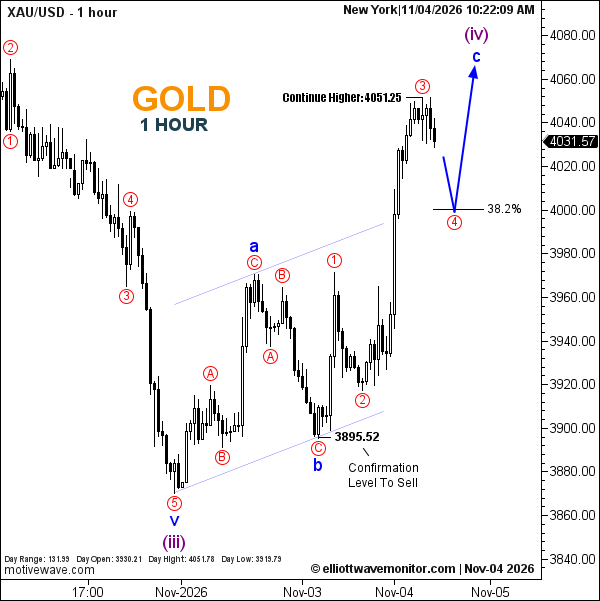
XAUUSD Elliott Wave Analysis
Gold extended the recovery described in the November 4 London session analysis, establishing a higher peak while preserving the broader corrective outlook.
The updated count places red wave 3 at the latest high within developing blue wave c. Although prices have retreated from that peak, the projected fourth-wave correction remains unconfirmed.
The blue forecast path anticipates a retracement toward Fibonacci 38.2%, followed by renewed upside to complete blue wave c within purple wave (iv).
Technical Analysis for November 4, 2026
- Wave Structure: Red 3 provisionally complete; red 4 projected.
- Fibonacci: 38.2% retracement.
- Upside Continuation Marker: $4,051.25.
- Sell Confirmation: $3,895.52.
Trader's Question: Has gold confirmed a sustained break above $4,051.25?
Not yet. The intraday high exceeded that marker, but the latest quote stands below it. The chart does not establish a sustained breakout.