
Key Points
- Gold breached the previous $3,870.18 invalidation threshold, ending the earlier bullish scenario.
- The revised Elliott Wave count identifies a developing bearish impulse.
- A temporary 38.2% Fibonacci rebound could precede further losses.
Gold Price
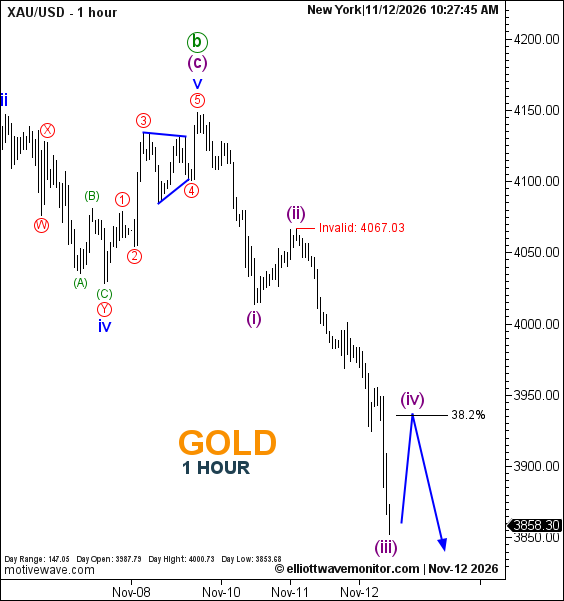
XAUUSD traded at $3,854.05 at 10:24 a.m. New York time, after recording a daily low of $3,853.68. The hourly chart shows an opening price of $3,987.79 and a session high of $4,000.73.
XAUUSD Elliott Wave Analysis
Gold's break below $3,870.18 has invalidated the bullish interpretation maintained in the November 12 London session outlook, requiring a fundamental reassessment of the wave structure.
The revised count identifies purple waves (i), (ii), and (iii) within a developing bearish sequence.
With wave (iii) provisionally labeled near the latest low, the projected path anticipates a corrective recovery through wave (iv) toward Fibonacci 38.2%, followed by renewed selling within wave (v).
The new bearish count carries an invalidation threshold of $4,067.03.
Technical Analysis for November 12, 2026
- Scenario: Previous bullish count invalidated.
- Structure: Purple (iii) provisionally complete.
- Next Waves: (iv) upward, then (v) downward.
- Fibonacci: 38.2% retracement.
- New Invalidation: $4,067.03.
Trader's Question: Would a rebound toward Fibonacci 38.2% restore the bullish outlook?
Not under the current count. Such a recovery would represent a potential fourth-wave correction rather than confirmation of a sustained bullish reversal.