
Key Points
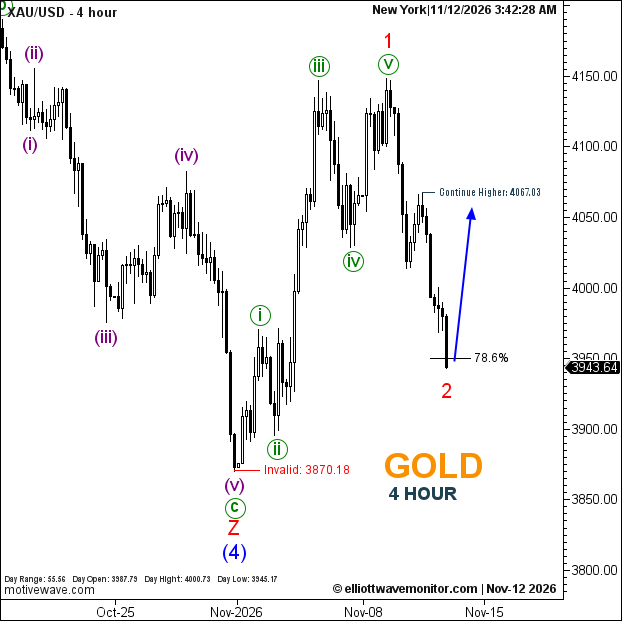
- Gold's decline has developed into a deep red wave 2 correction following the advance to $4,148.66.
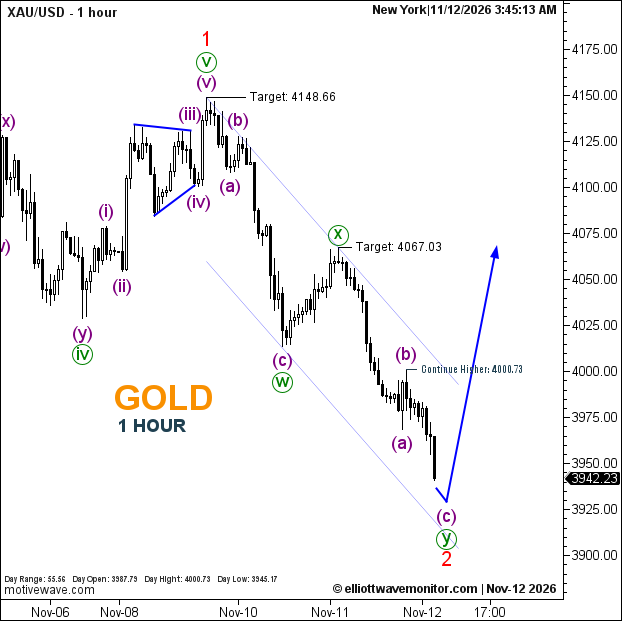
- The hourly count identifies a W–X–Y structure, with its final downward leg still developing.
- Sustained trading above $4,000 is needed before an initial bullish recovery signal emerges.
Gold Price: XAUUSD traded at $3,942.23 at 3:45 a.m. New York time. The preceding four-hour snapshot showed $3,943.64 at 3:42 a.m.
XAUUSD Elliott Wave Analysis
Gold's persistent selling has prompted a higher-degree reassessment of the corrective structure discussed in the November 11 New York session analysis.
The four-hour count now identifies the advance from $3,870.18 to $4,148.66 as red wave 1, followed by a sharp second-wave retracement approaching Fibonacci 78.6%.
The hourly chart provides further detail: green wave (y) has extended below the psychologically important $4,000 level following the $4,000.73 reference.
With no confirmed corrective low, renewed upside remains conditional. A sustained recovery above $4,000 would offer preliminary improvement, while a move below $3,870.18 would invalidate the current bullish count.
Technical Analysis for November 12, 2026
- Structure: Red wave 2 developing; green W–X–Y correction.
- Fibonacci: 78.6% retracement on H4.
- Recovery References: $4,000.73 and $4,067.03.
- Invalidation: $3,870.18.
Trader's Question: Does a rebound above $4,000 confirm the correction has ended?
Not automatically. A close above that threshold followed by sustained trading would improve the recovery outlook, but wave 2 completion still requires confirmation.