
Key Points
- Gold has retreated from its latest recovery high.
- A developing W–X–Y correction replaces the previously anticipated immediate fifth-wave extension.
- Another advance remains projected after red wave 4 concludes.
Gold Price: XAUUSD traded at $4,103.64 at 3:54 p.m. New York time. The hourly chart records a daily high of $4,146.97 and low of $4,057.67, against an opening price of $4,061.56.
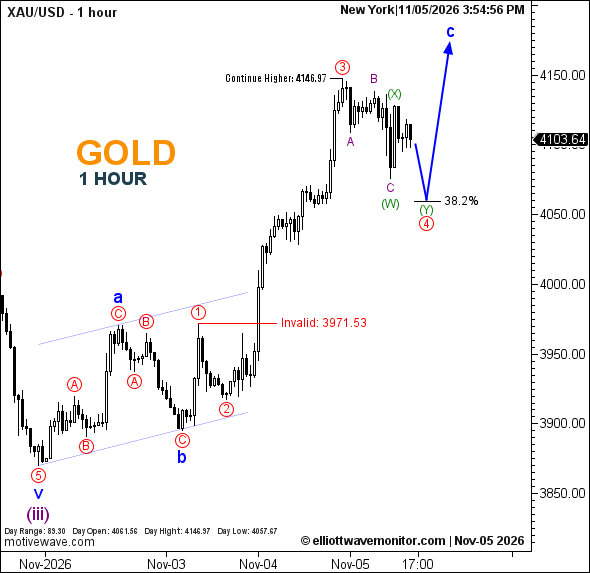
XAUUSD Elliott Wave Analysis
Gold's retreat has prompted a revision to the structure outlined in the November 5 London session analysis, which anticipated a final upward extension before a potential decline.
The updated count places red wave 3 at the established peak. Subsequent price action has developed purple waves A–B–C within green wave (W), followed by green wave (X).
The projected path now favors green wave (Y) declining toward the 38.2% Fibonacci retracement to complete red wave 4. Another advance within blue wave c is subsequently anticipated, although neither projected leg is confirmed.
Technical Analysis for November 5, 2026
- Structure: Red wave 4 correction developing.
- Next Wave: Green (Y), projected.
- Fibonacci: 38.2% retracement.
- Upside Reference: $4,146.97.
- Invalidation: $3,971.53.
Trader's Question: Is $3,971.53 the projected corrective target?
No. It is the chart's invalidation threshold. The anticipated fourth-wave destination is associated with Fibonacci 38.2%, not that lower boundary.