
Gold Rate: XAUUSD stood at $4,093.63 on the four-hour chart at 10:25 AM New York time, extending its decline below $4,110.84.
Gold Elliott Wave Analysis
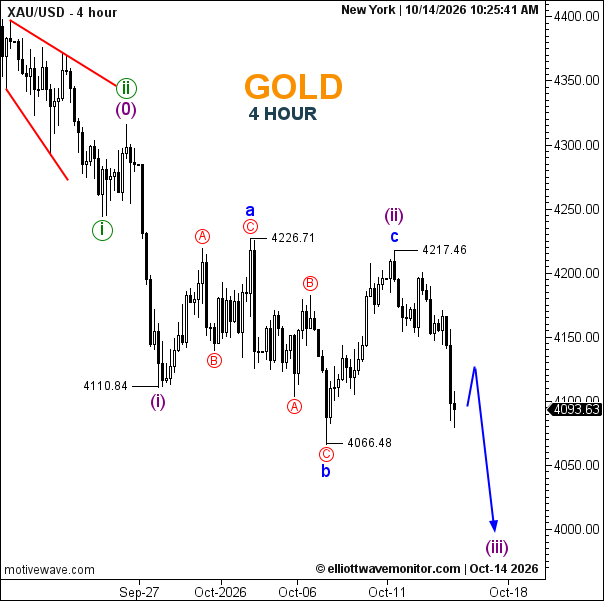
The chart shows wave (i) completed at $4,110.84, followed by an A–B–C correction in wave (ii), ending at $4,217.46.
Gold is now potentially entering bearish wave (iii), with the chart projecting further weakness toward $4,000.
- Wave Structure: Bearish impulse.
- Trendline: Descending.
- Support: $4,066.48, then $4,000.
- Resistance: $4,150 and $4,217.46.
A temporary rebound toward $4,120–$4,150 could precede further selling. Breaking below $4,066.48 would strengthen bearish confirmation, while recovery above $4,217.46 would invalidate the proposed wave (ii) completion.
Gold News: September US inflation reached 3.7% annually, above the 3.6% forecast. Higher Treasury yields and a stronger dollar pressured bullion, while Thursday’s US producer inflation report remains in focus.