
Key Points
- Gold has broken below the previous $3,669.83 low.
- Green wave (3) is followed by a fourth-wave recovery near Fibonacci 38.2%.
- Another bearish extension remains projected before red wave ③ concludes.
Gold Price
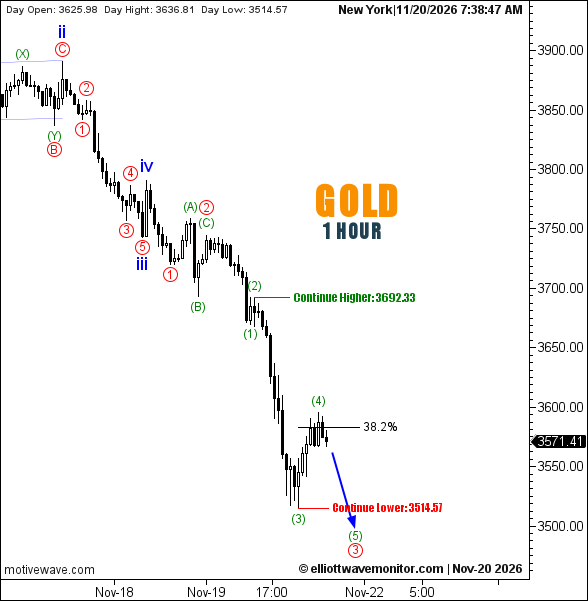
XAUUSD stood at $3,571.41 at 7:38 a.m. New York time, below its daily opening of $3,625.98. The hourly chart recorded a high of $3,636.81 and a low of $3,514.57.
Gold Elliott Wave Analysis
The bearish continuation anticipated in EWM's November 19 gold assessment has unfolded after the corrective recovery, with prices establishing a substantially lower trough.
The updated hourly count places green wave (2) within completed price action, followed by a pronounced wave (3) decline. A subsequent wave (4) rebound has approached the 38.2% Fibonacci retracement.
The structure now favors another downward leg through green wave (5), potentially completing the larger red wave ③. However, the projected decline remains unconfirmed.
Technical Analysis — November 20, 2026
- Trend: Bearish, H1.
- Structure: Red ③ developing; green (5) projected.
- Fibonacci: 38.2% fourth-wave retracement.
- Downside continuation: Below $3,514.57.
- Upside continuation: $3,692.33.
Trader's Question: Does the fourth-wave rebound establish a lasting bottom?
Not under the current count. It remains corrective, while confirmation of another bearish extension would require renewed selling and further structural development.