
Silver Rate: XAGUSD traded at $56.182 on the four-hour chart at 10:25 AM New York time, extending its decline below the previous $58.505 low.
Silver Elliott Wave Analysis
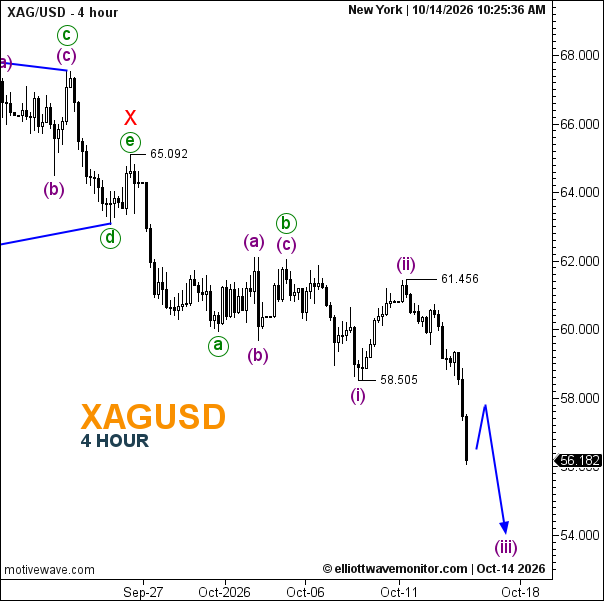
The chart identifies wave X at $65.092, followed by a developing bearish wave Y. Within the latest decline, wave (i) ended at $58.505 and wave (ii) rebounded to $61.456.
The sharp selloff suggests wave (iii) is underway, with a projected downside objective near $54.
- Wave Structure: Bearish impulse within wave Y.
- Trendline: Descending.
- Support: $56, then $54.
- Resistance: $58.505, then $61.456.
A corrective bounce toward $57.50–$58 may precede further losses. Recovery above $61.456 would challenge the immediate wave (iii) interpretation.
Silver News: US inflation reached 3.7% annually in September, lifting Treasury yields and pressuring silver. Markets now await Thursday’s US Producer Price Index release.