
Key Points
- Silver has extended its decline below the previous session's trough.
- Blue wave i is marked at the latest low.
- A temporary recovery toward Fibonacci 50% could precede further weakness.
Silver Price
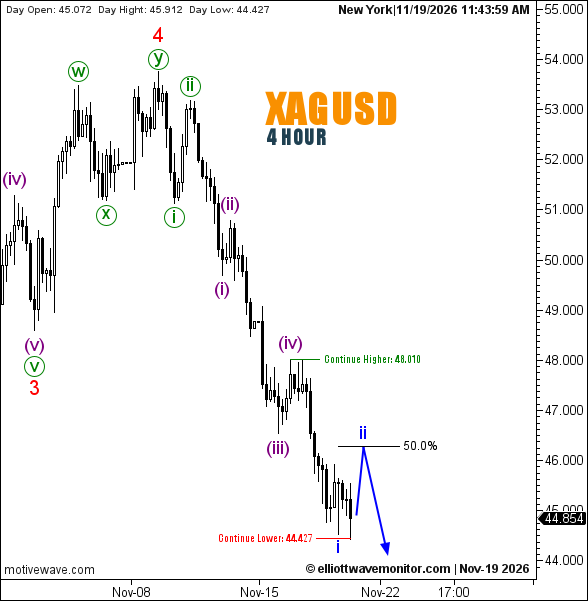
XAGUSD stood at $44.854 at 11:43 a.m. New York time, below its daily opening of $45.072. The four-hour chart recorded a high of $45.912 and a low of $44.427.
Silver Elliott Wave Analysis
The bearish extension anticipated in EWM's November 18 silver assessment has progressed beneath the previous $45.136 trough, reinforcing the established downward structure.
The updated count now identifies blue wave i at the latest low, following the earlier completion of purple wave (iv).
Attention shifts to a potential blue wave ii recovery toward the 50% Fibonacci retracement. The projected path subsequently anticipates another decline, although neither prospective movement has been confirmed.
The chart does not explicitly identify the completion of the larger purple wave (v).
Technical Analysis — November 19, 2026
- Trend: Bearish, H4.
- Structure: Blue i marked; ii projected.
- Fibonacci: 50% corrective retracement.
- Upside continuation: $48.010.
- Downside continuation: Below $44.427.
Trader's Question: Does the new low establish a confirmed floor for silver?
No. The $44.427 level represents an observed trough, not confirmed structural support. A subsequent break beneath it would strengthen downside continuation.