
Key Points
- Silver registered a lower intraday trough, extending the corrective movement.
- The Elliott Wave count remains unchanged, with blue wave ii still projected.
- A 50% Fibonacci retracement could precede another upward extension.
Silver Price: XAGUSD traded at $52.258 at 9:59 a.m. New York time. The four-hour chart records a daily high of $53.191 and low of $51.375, against an opening price of $51.546.
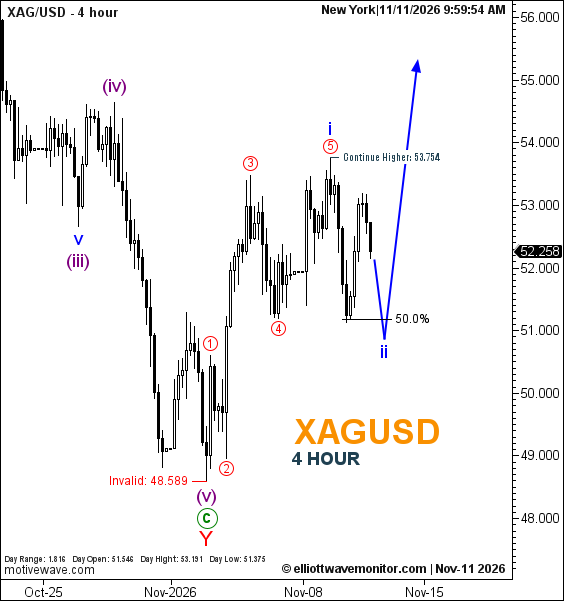
XAGUSD Elliott Wave Analysis
Silver's correction has deepened since the November 10 price forecast, with the latest session low falling beneath the previously recorded $52.192 trough.
Despite the additional weakness, the Elliott Wave structure remains intact. Red wave 5 and blue wave i retain their positions at the preceding recovery peak.
The projected path continues to favor a decline toward the 50% Fibonacci retracement to complete blue wave ii, followed by renewed upside.
However, neither corrective completion nor the subsequent advance has been confirmed.
Technical Analysis for November 11, 2026
- Structure: Blue i provisionally complete; ii developing.
- Fibonacci: 50% retracement projected.
- Upside Continuation: $53.754.
- Invalidation: $48.589.
Trader's Question: Does the latest lower intraday low invalidate the broader recovery?
Not under the current count. The invalidation threshold remains substantially lower, while the second-wave correction has yet to establish a confirmed endpoint.