
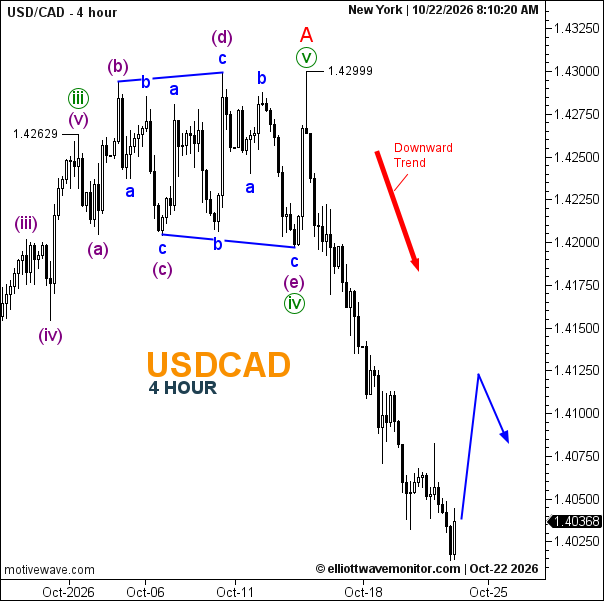
The USDCAD 4-hour chart maintains a bearish outlook as sellers extend the decline from 1.42999 toward 1.40368, establishing successive lower highs and lower lows. Following the completion of wave A and green wave (v) at 1.42999, the Elliott Wave structure suggests that a broader downward correction is unfolding. The breakdown below the previously established consolidation structure reinforces bearish momentum, although the extended decline leaves room for a temporary recovery. The projected price path indicates a corrective rebound toward 1.4120 before renewed selling pressure potentially drives USDCAD toward 1.4030 and the psychological 1.4000 support level. Immediate resistance stands near 1.4050–1.4075, while a sustained recovery above 1.4120 would weaken the near-term bearish continuation outlook.