
Key Points
- USD/CAD's latest wave count reveals further development within the bearish structure.
- Blue waves i and ii are now labeled following the preceding purple wave (ii) correction.
- The downside outlook remains intact, with 1.39297 marking the next lower reference.
USDCAD Rate: USD/CAD traded at 1.39913 at 9:41 a.m. New York time. The four-hour chart records a daily high of 1.39920 and low of 1.39427, against an opening rate of 1.39775.
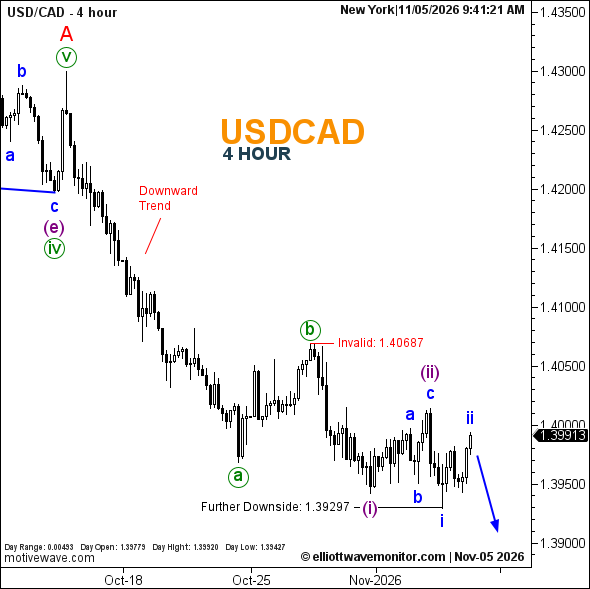
USDCAD Elliott Wave Analysis
The bearish structure described in the November 4 USDCAD price outlook has developed a clearer internal wave sequence, without materially changing its directional forecast.
The updated count retains purple wave (ii) at the preceding corrective peak, followed by blue wave i at the subsequent low and wave ii at the latest rebound.
This structure supports the possibility of another bearish extension, as illustrated by the blue projection. However, the anticipated decline has yet to be established.
Technical Analysis for November 5, 2026
- Trend: Bearish.
- Wave Structure: Blue i labeled; blue ii provisionally complete.
- Downside Reference: 1.39297.
- Invalidation: 1.40687.
Trader's Question: Has USD/CAD broken below 1.39297?
Not during the displayed daily range. The recorded low of 1.39427 remains above that reference, leaving the projected bearish extension unconfirmed.